“Everyone dies.”
– Elon Musk
Although most of us try to delay the inevitable as long as possible, death is a fact of life. Most people do not even like to mention it. In the midst of a pandemic, however, death is a hot topic. Yes, everyone dies, but what is killing us and how has COVID-19 changed the “deathscape”?
Causes of death are many and sometimes difficult to pinpoint in individual cases. Data available from the Alberta (Canada) government covering 2001 through 2019 lists more than 350 categories. Often, there are multiple contributing factors that are not reflected in the single “cause of death”. You will be happy to hear, though, that no one in this 19-year interval has died of plague – at least in Alberta.
We looked at all deaths in Alberta from 2001 to 2019, categorized by cause, gender,[1] and age group.[2] (2020 data for causes other than COVID-19 is either not yet reported or preliminary, and therefore neither reliable nor complete enough for this detailed study.) Obviously, there was no COVID-19 death prior to 2020 – the first COVID-19-attributed death in Alberta was recorded on March 18, 2020[3] – but we can compare the COVID deaths in 2020 to 2019 deaths of all causes, or extrapolate death trends of all causes to 2020 and compare COVID deaths to a statistical estimate of the expected 2020 numbers had there been no COVID. The latter is the basis for what is referred to as “excess deaths”.
COVID-19 has had worldwide consequences; by April, 2021, almost 150 million have been infected (counting confirmed cases only), over 3 million of whom have died.[4] Various approaches have been taken to reduce the spread or respond to the crisis in different jurisdictions, with varying levels of success. While we would like to analyse and compare the results of these different COVID responses to typical death expectations, it is important to have a consistently gathered and reported dataset, not only of COVID deaths, but of all others with which to compare. For this reason, a relatively small, but self-contained, consistent, and presumably trustworthy, dataset was chosen – Alberta, Canada.
Alberta is a province in Western Canada with approximately 4.4 million people. There are two cities of more than one million each, many smaller cities and towns, and a large rural population in the ranching and farming countryside. There is a broad range of income, education levels, careers, political opinion, and racial, ethnic, and cultural backgrounds. Relative to global lifestyles, Alberta has a very high standard of living, including high-quality, publicly funded medical care and education. Death trends in Alberta might reasonably be relevant and scalable to similar first-world jurisdictions.
Each graph will be explained separately, but a few notes about the overall data and assumptions in the analysis: all causes of death were first grouped into general categories, such as cancer, heart disease, and accidents. Absolute numbers of deaths in each category were compared in an absolute sense, and also normalized for annual population variations by age group and gender using a “per 100,000” value, so year-over-year comparisons are valid. Since COVID deaths in 2020 did not conveniently start in January, COVID deaths were counted through March 2021 so that a full year of data was included for comparison with other causes of death summed annually.
Let’s start with a look at the living before diving into death details and comparisons. The total population of Alberta in 2020 was 4.4 million, but if we are going to look at annual deaths relative to gender and age group, we should compare to the appropriate population by gender and age group. Therefore, the “per 100,000” qualifier mentioned above was broken into “per 100,000 per gender per age group”. This means that if we see that there are 1,000 male deaths in 2008 in the 70-79 age range, we will be dividing 1,000 by, not the total 2008 population (in 100s of 1,000s), but only the specific number of men in that age group.
This method gives us a clear look at the variations and proportions of causes of death as a function of gender and age. To that end, we need to first understand how the population is distributed by year, gender, and age group. The population of living people, divided by gender, is shown for each age group in Graph 1.[5]
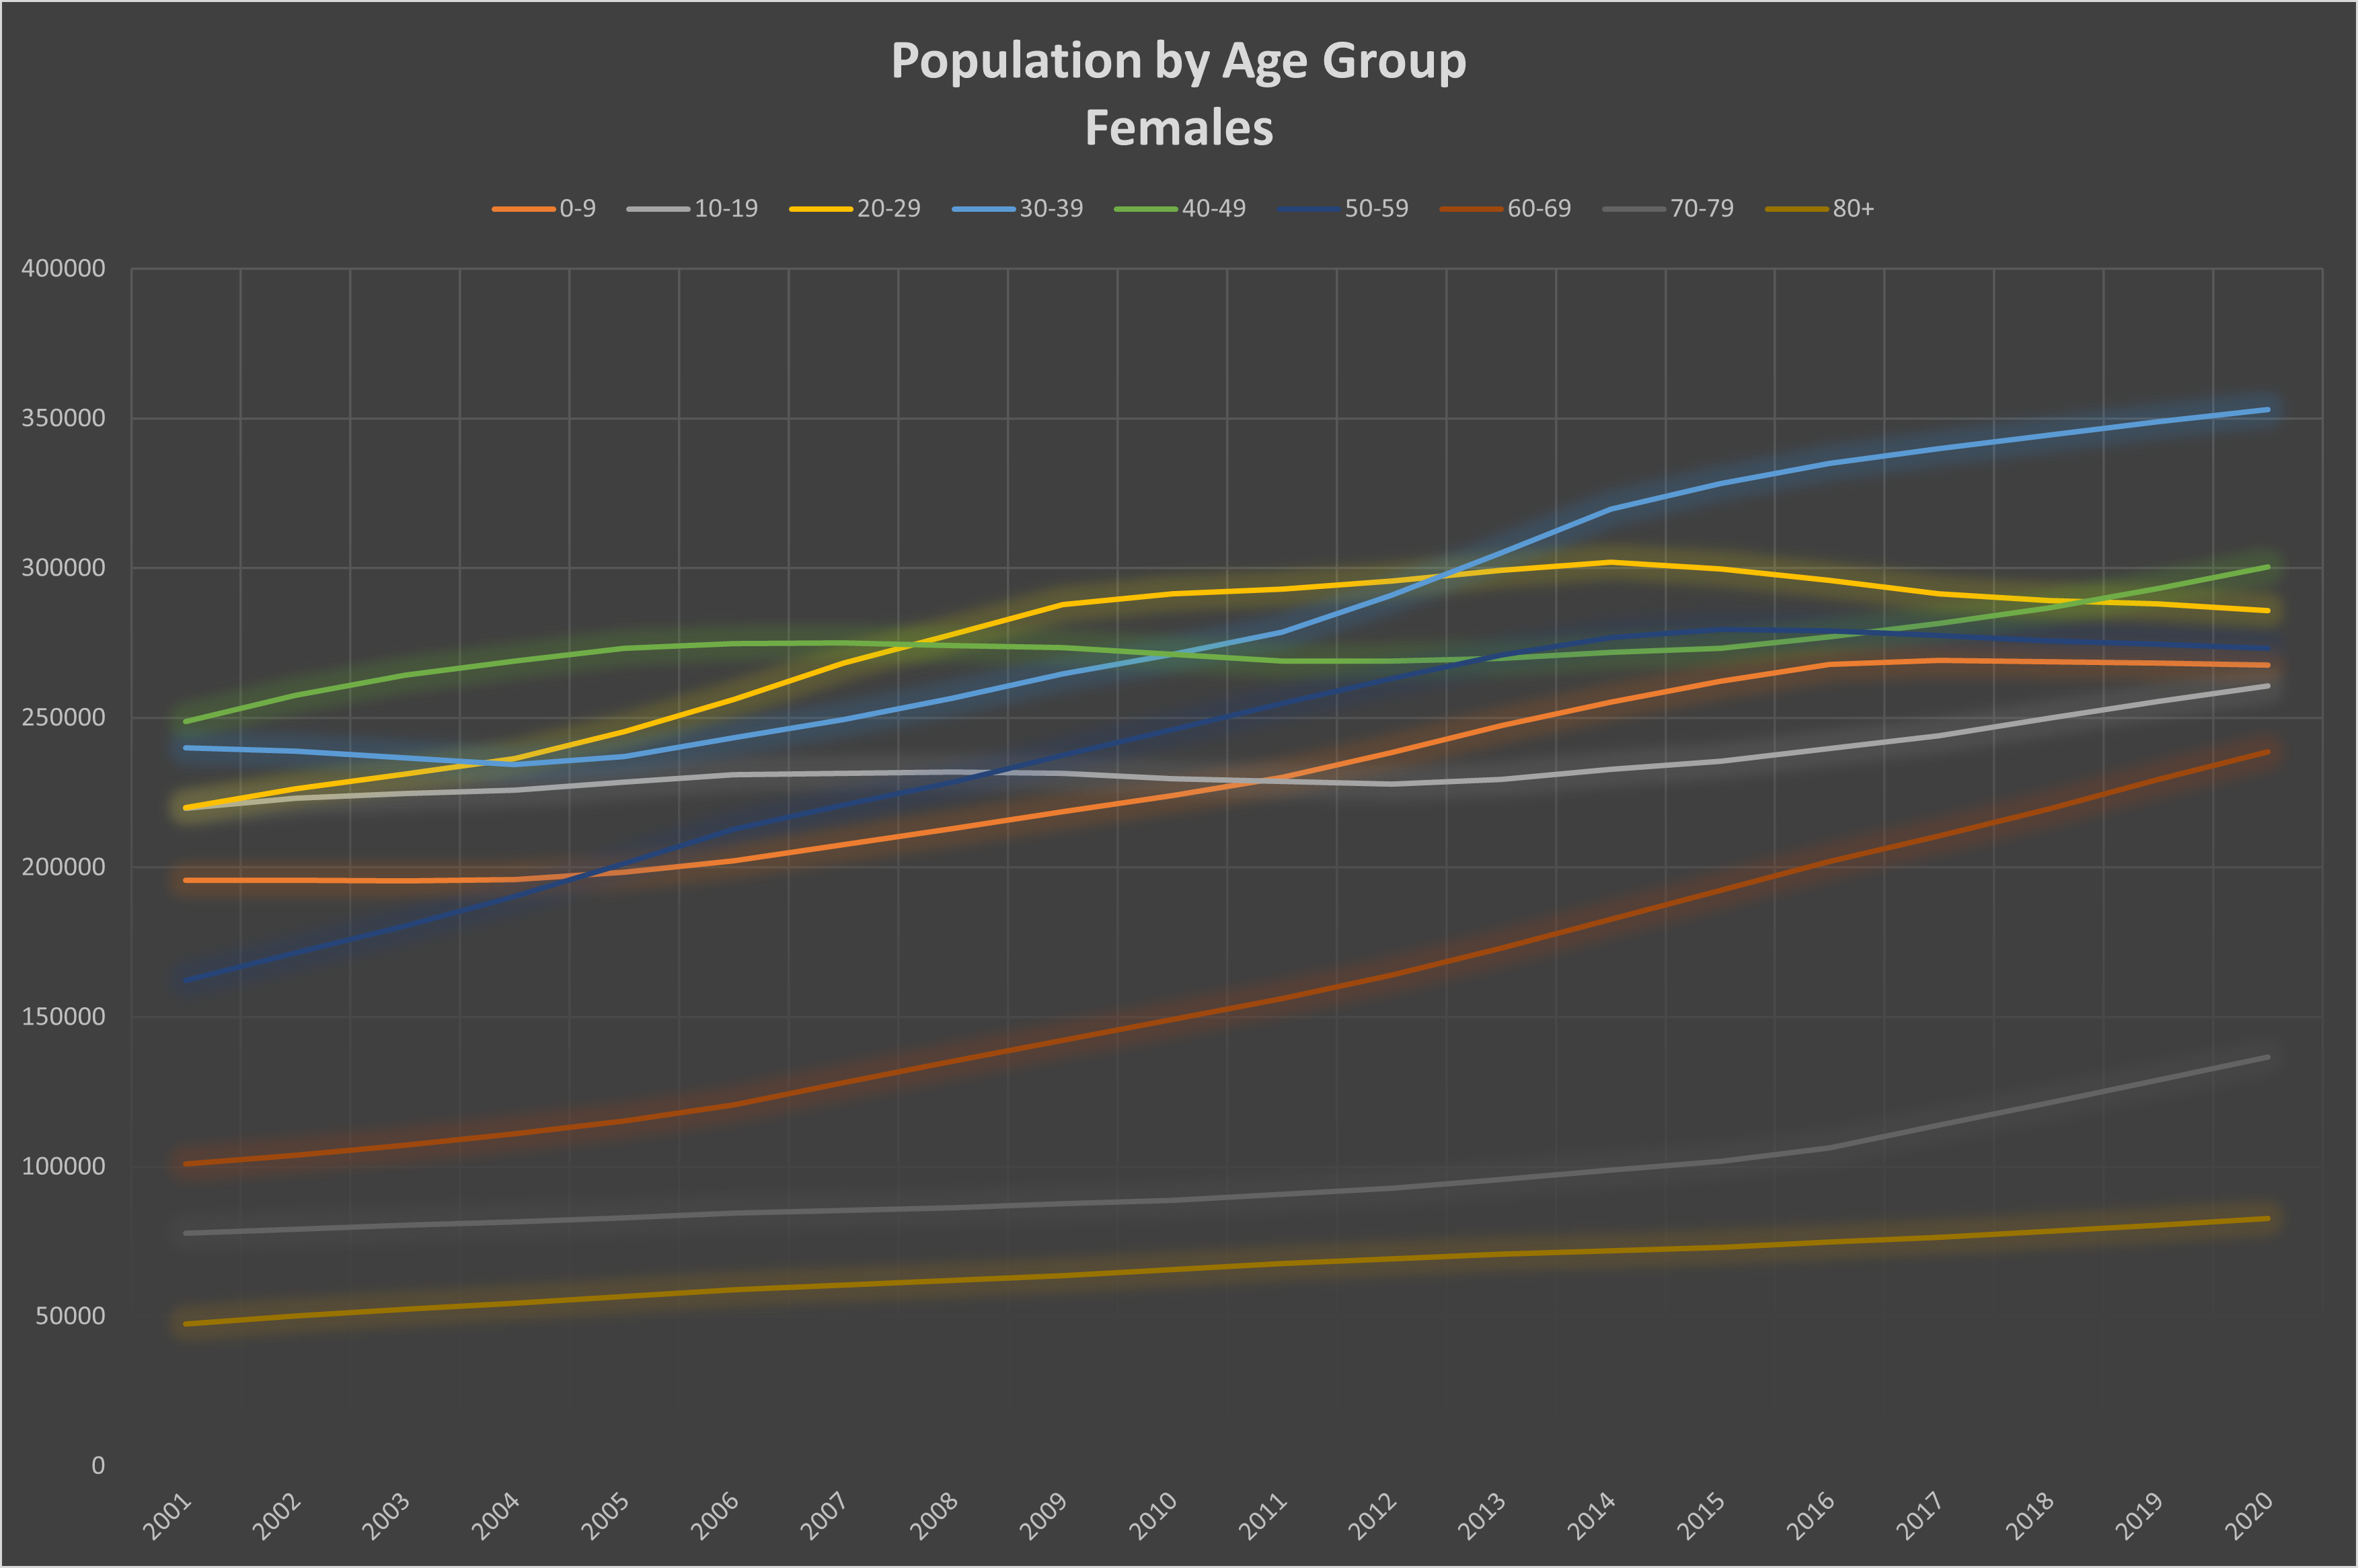
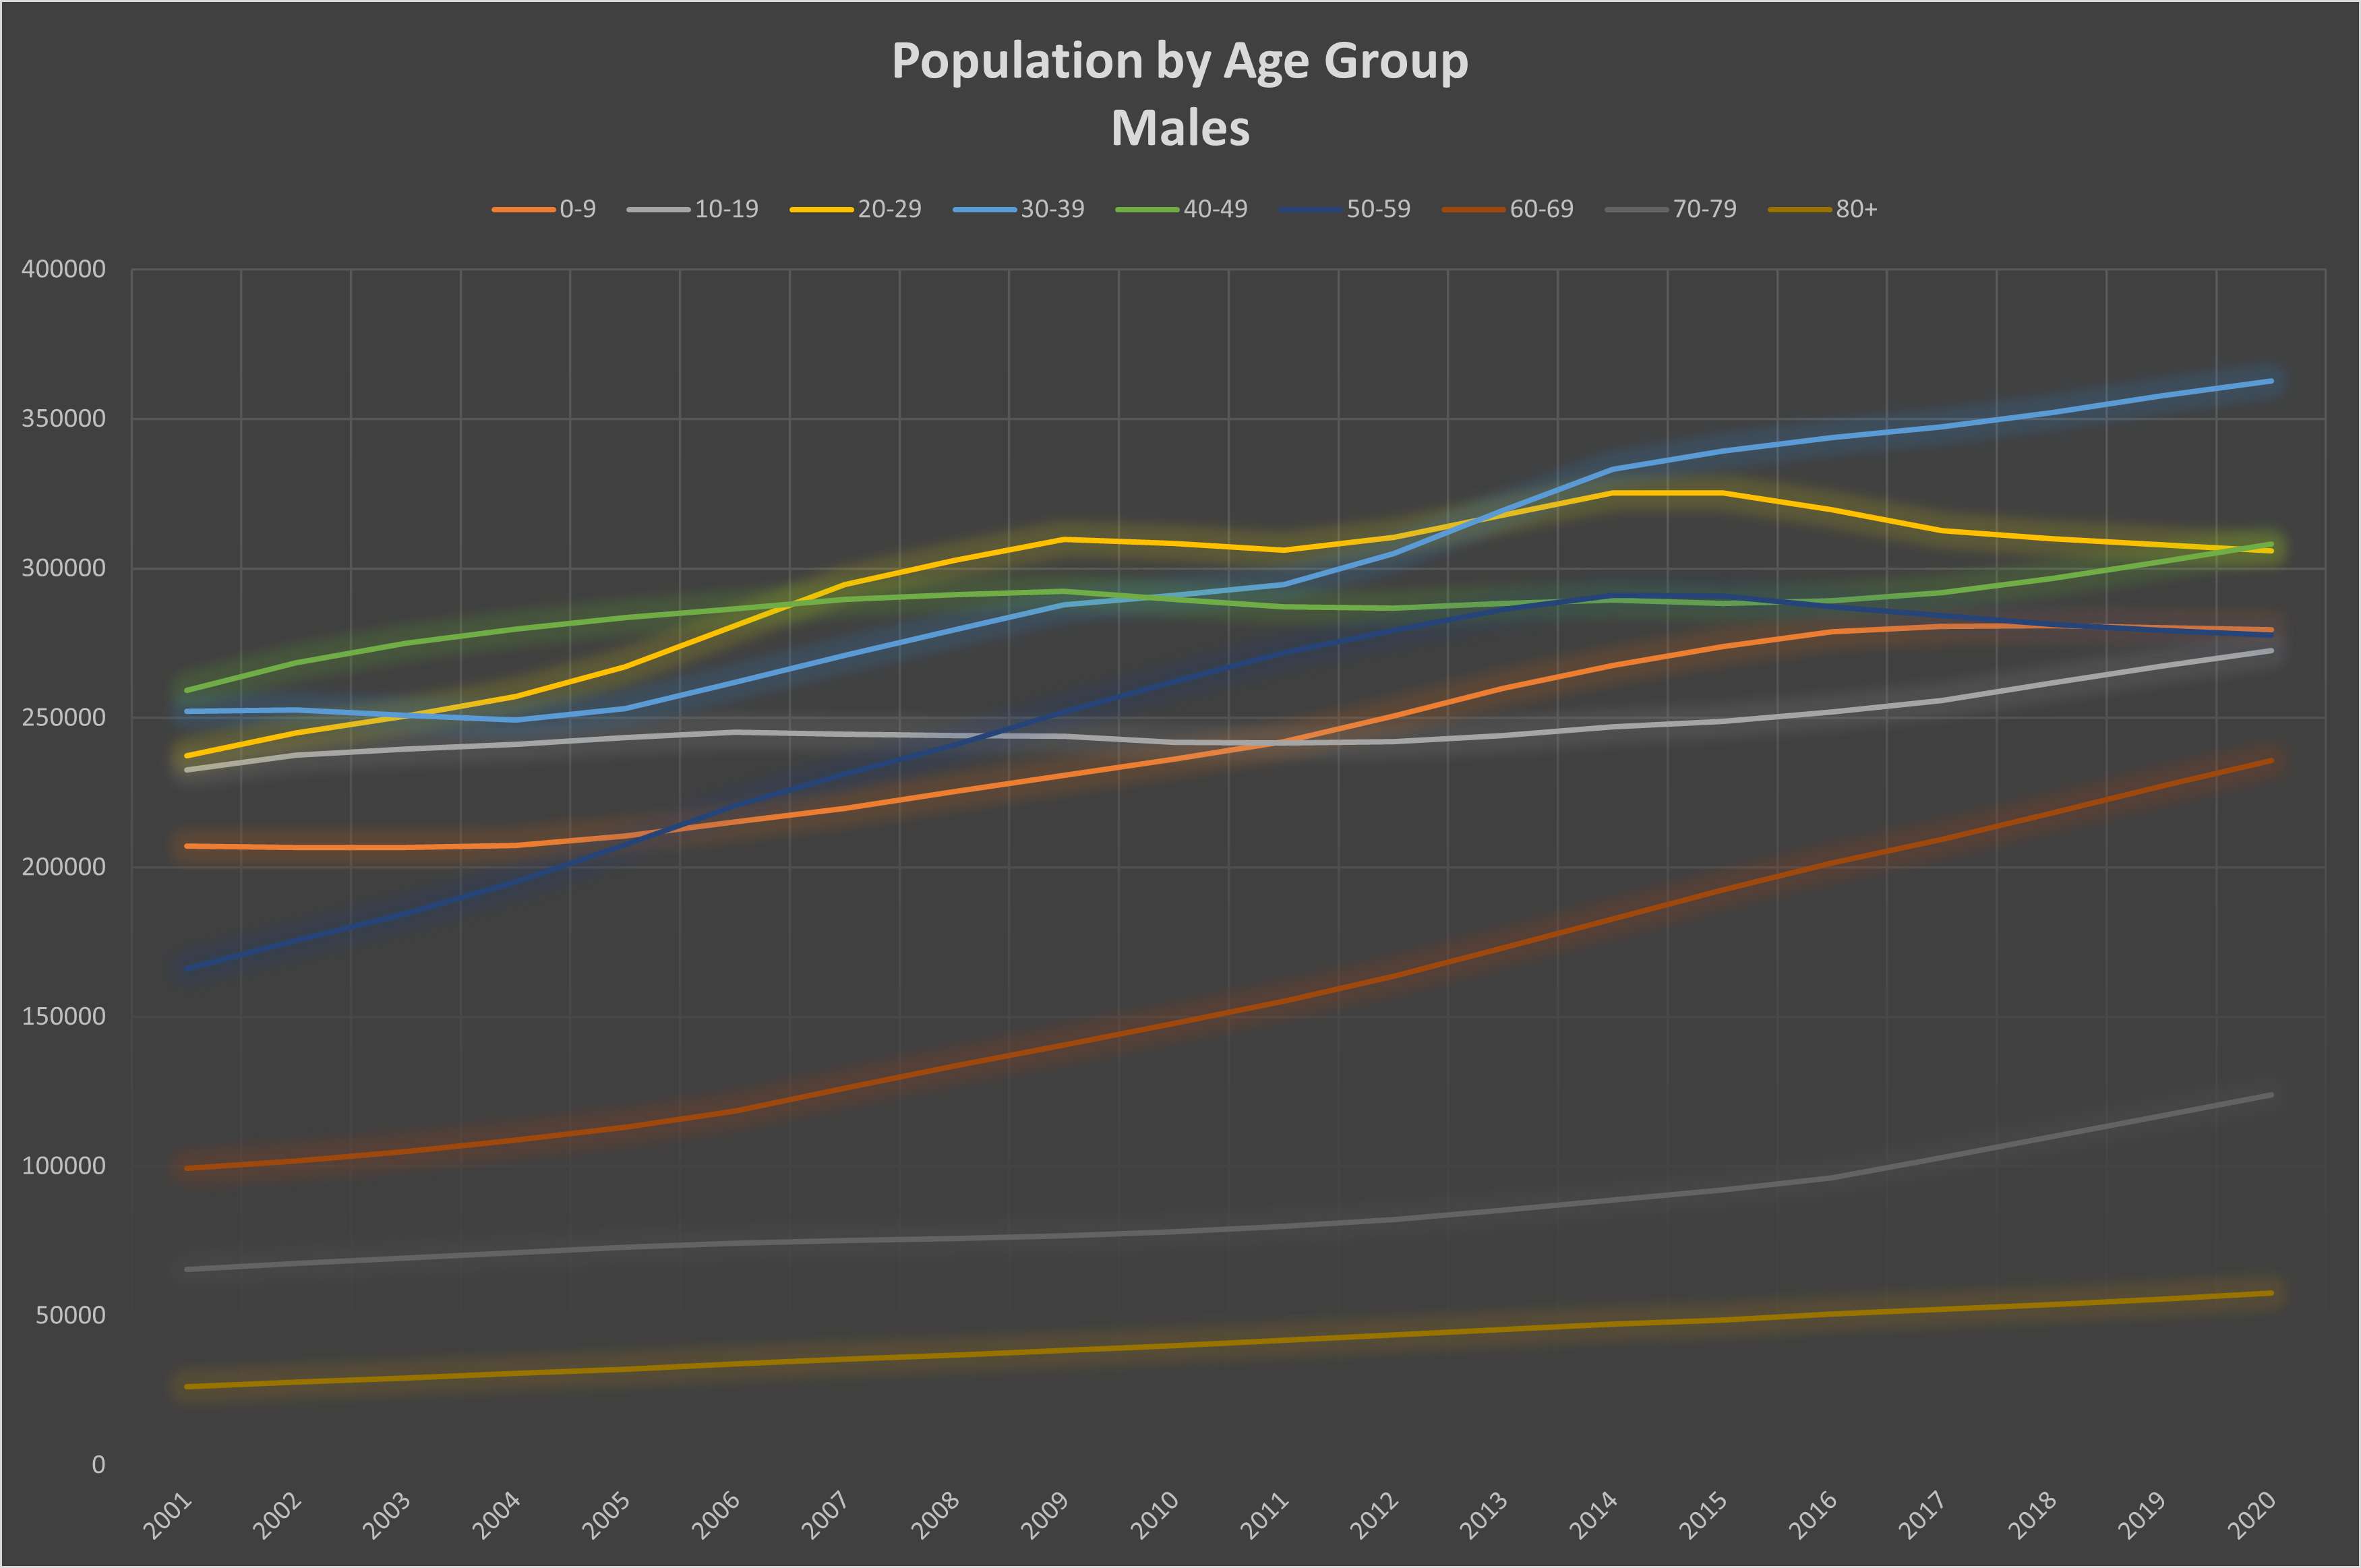
Graph 1: Total population by year and age group. Top: females; bottom: males.
Now that we have a baseline of specific population groupings, we can start looking at the causes of death in separate groups and how the COVID-19 numbers compare.
Beginning with an overview, Graph 2 compares the total number of COVID deaths (counted for a full year)[6] to the total number of deaths of all causes in 2019 in each 10-year age range; Graph 3 splits this chart by gender. Recall that 2020 deaths of causes other than COVID are not reliably reported yet, hence the comparison with 2019 numbers. These graphs have not been corrected for the slight population growth between 2019 and 2020. This deficiency results in a small overstatement of the red bars, relative to the 2019 blue bars. On these scales, the effect of the adjustment would be hardly noticeable. The purpose of these charts is to show the relative death rates for different age groups and genders.
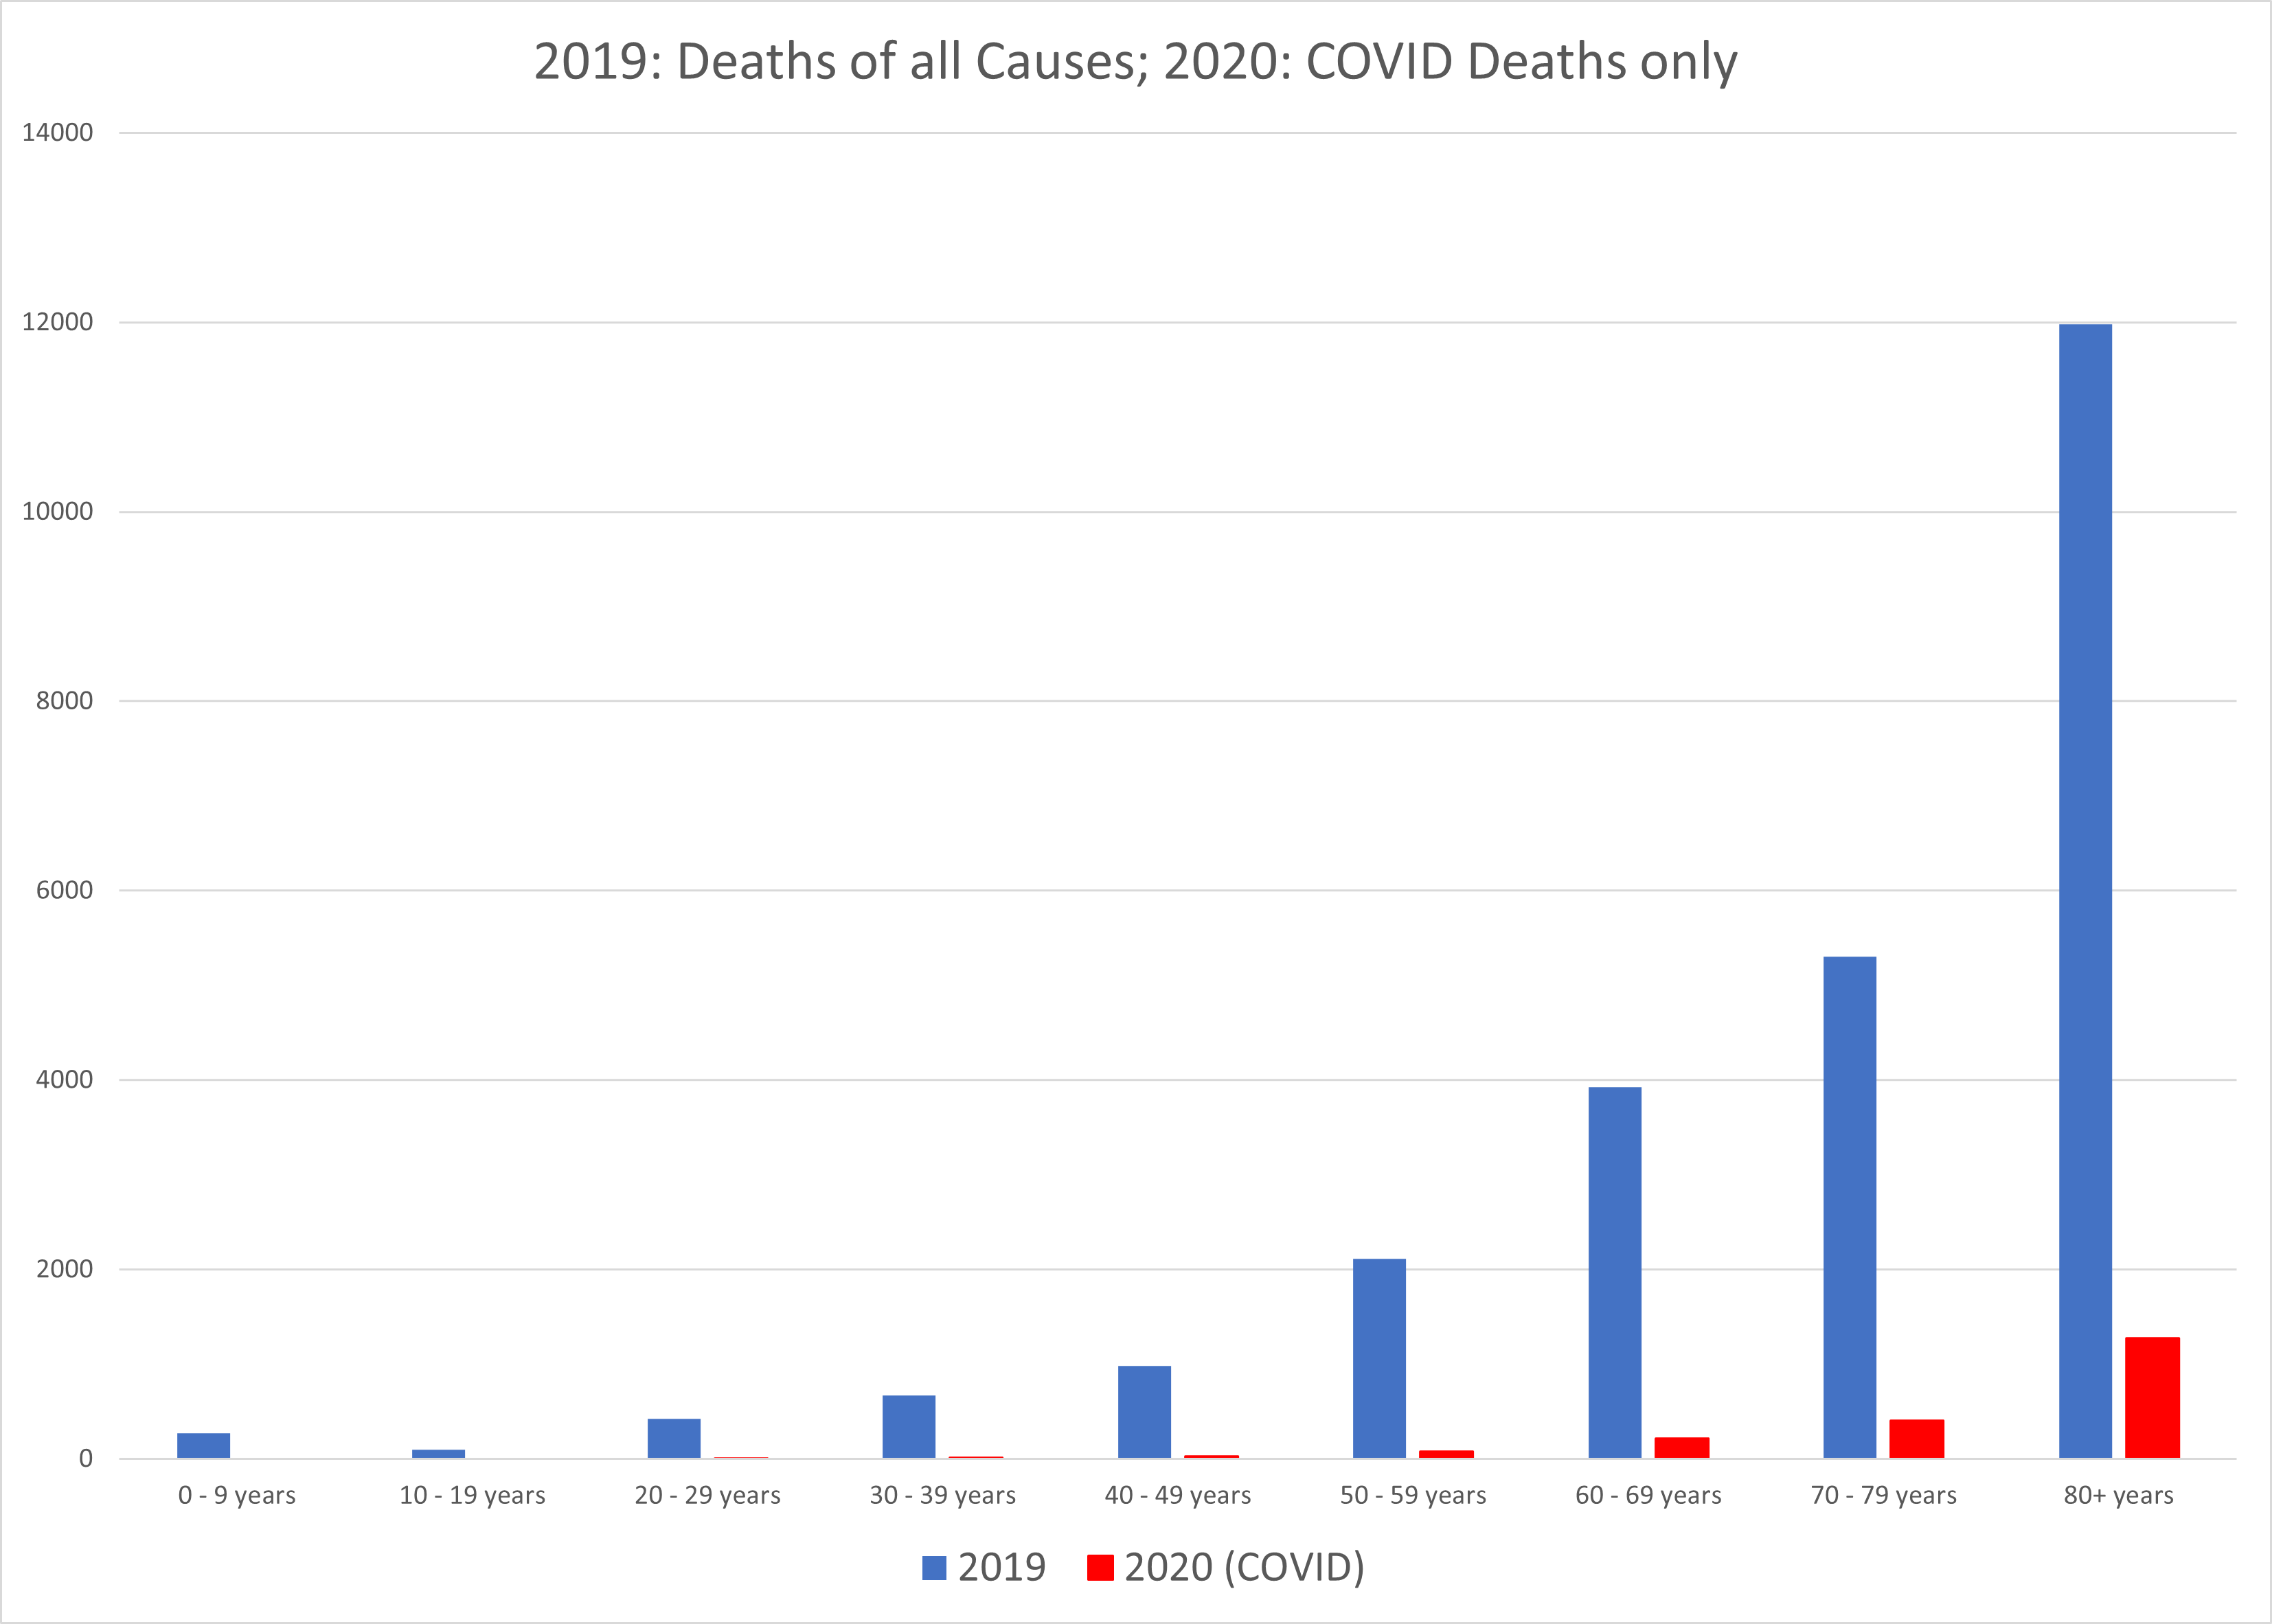
Graph 2: Deaths of all causes in 2019 compared with COVID deaths in 2020.
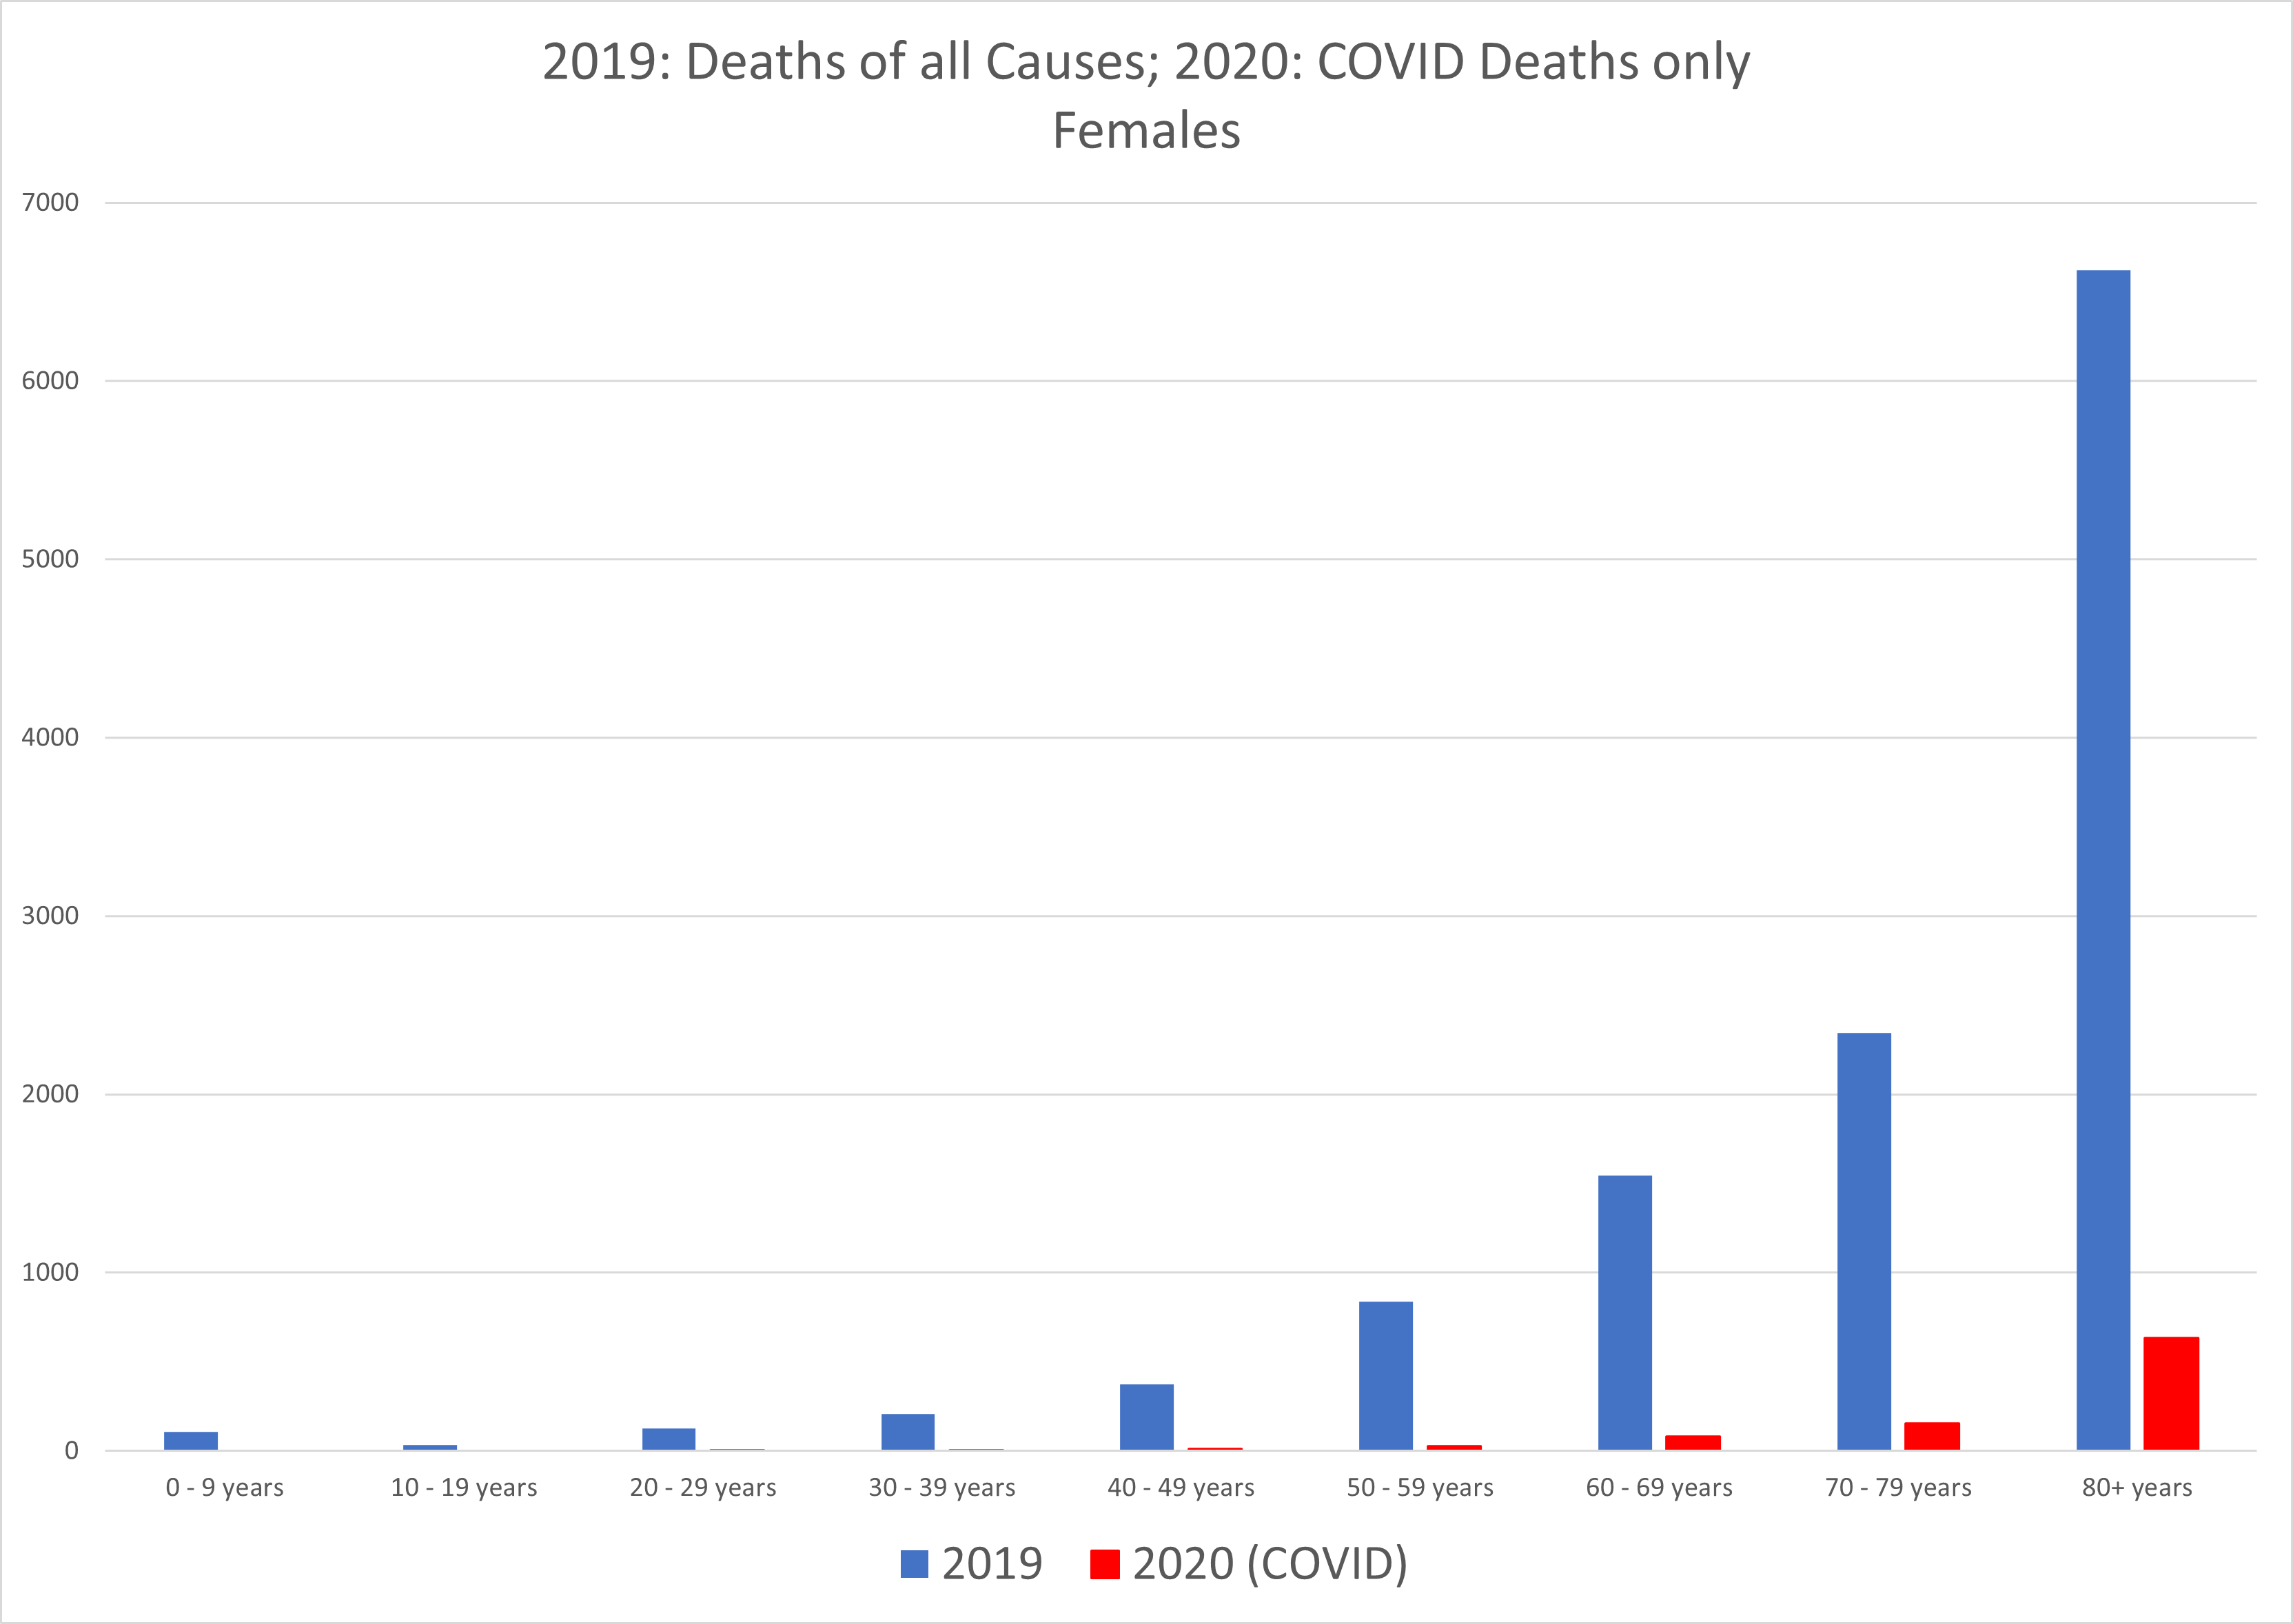
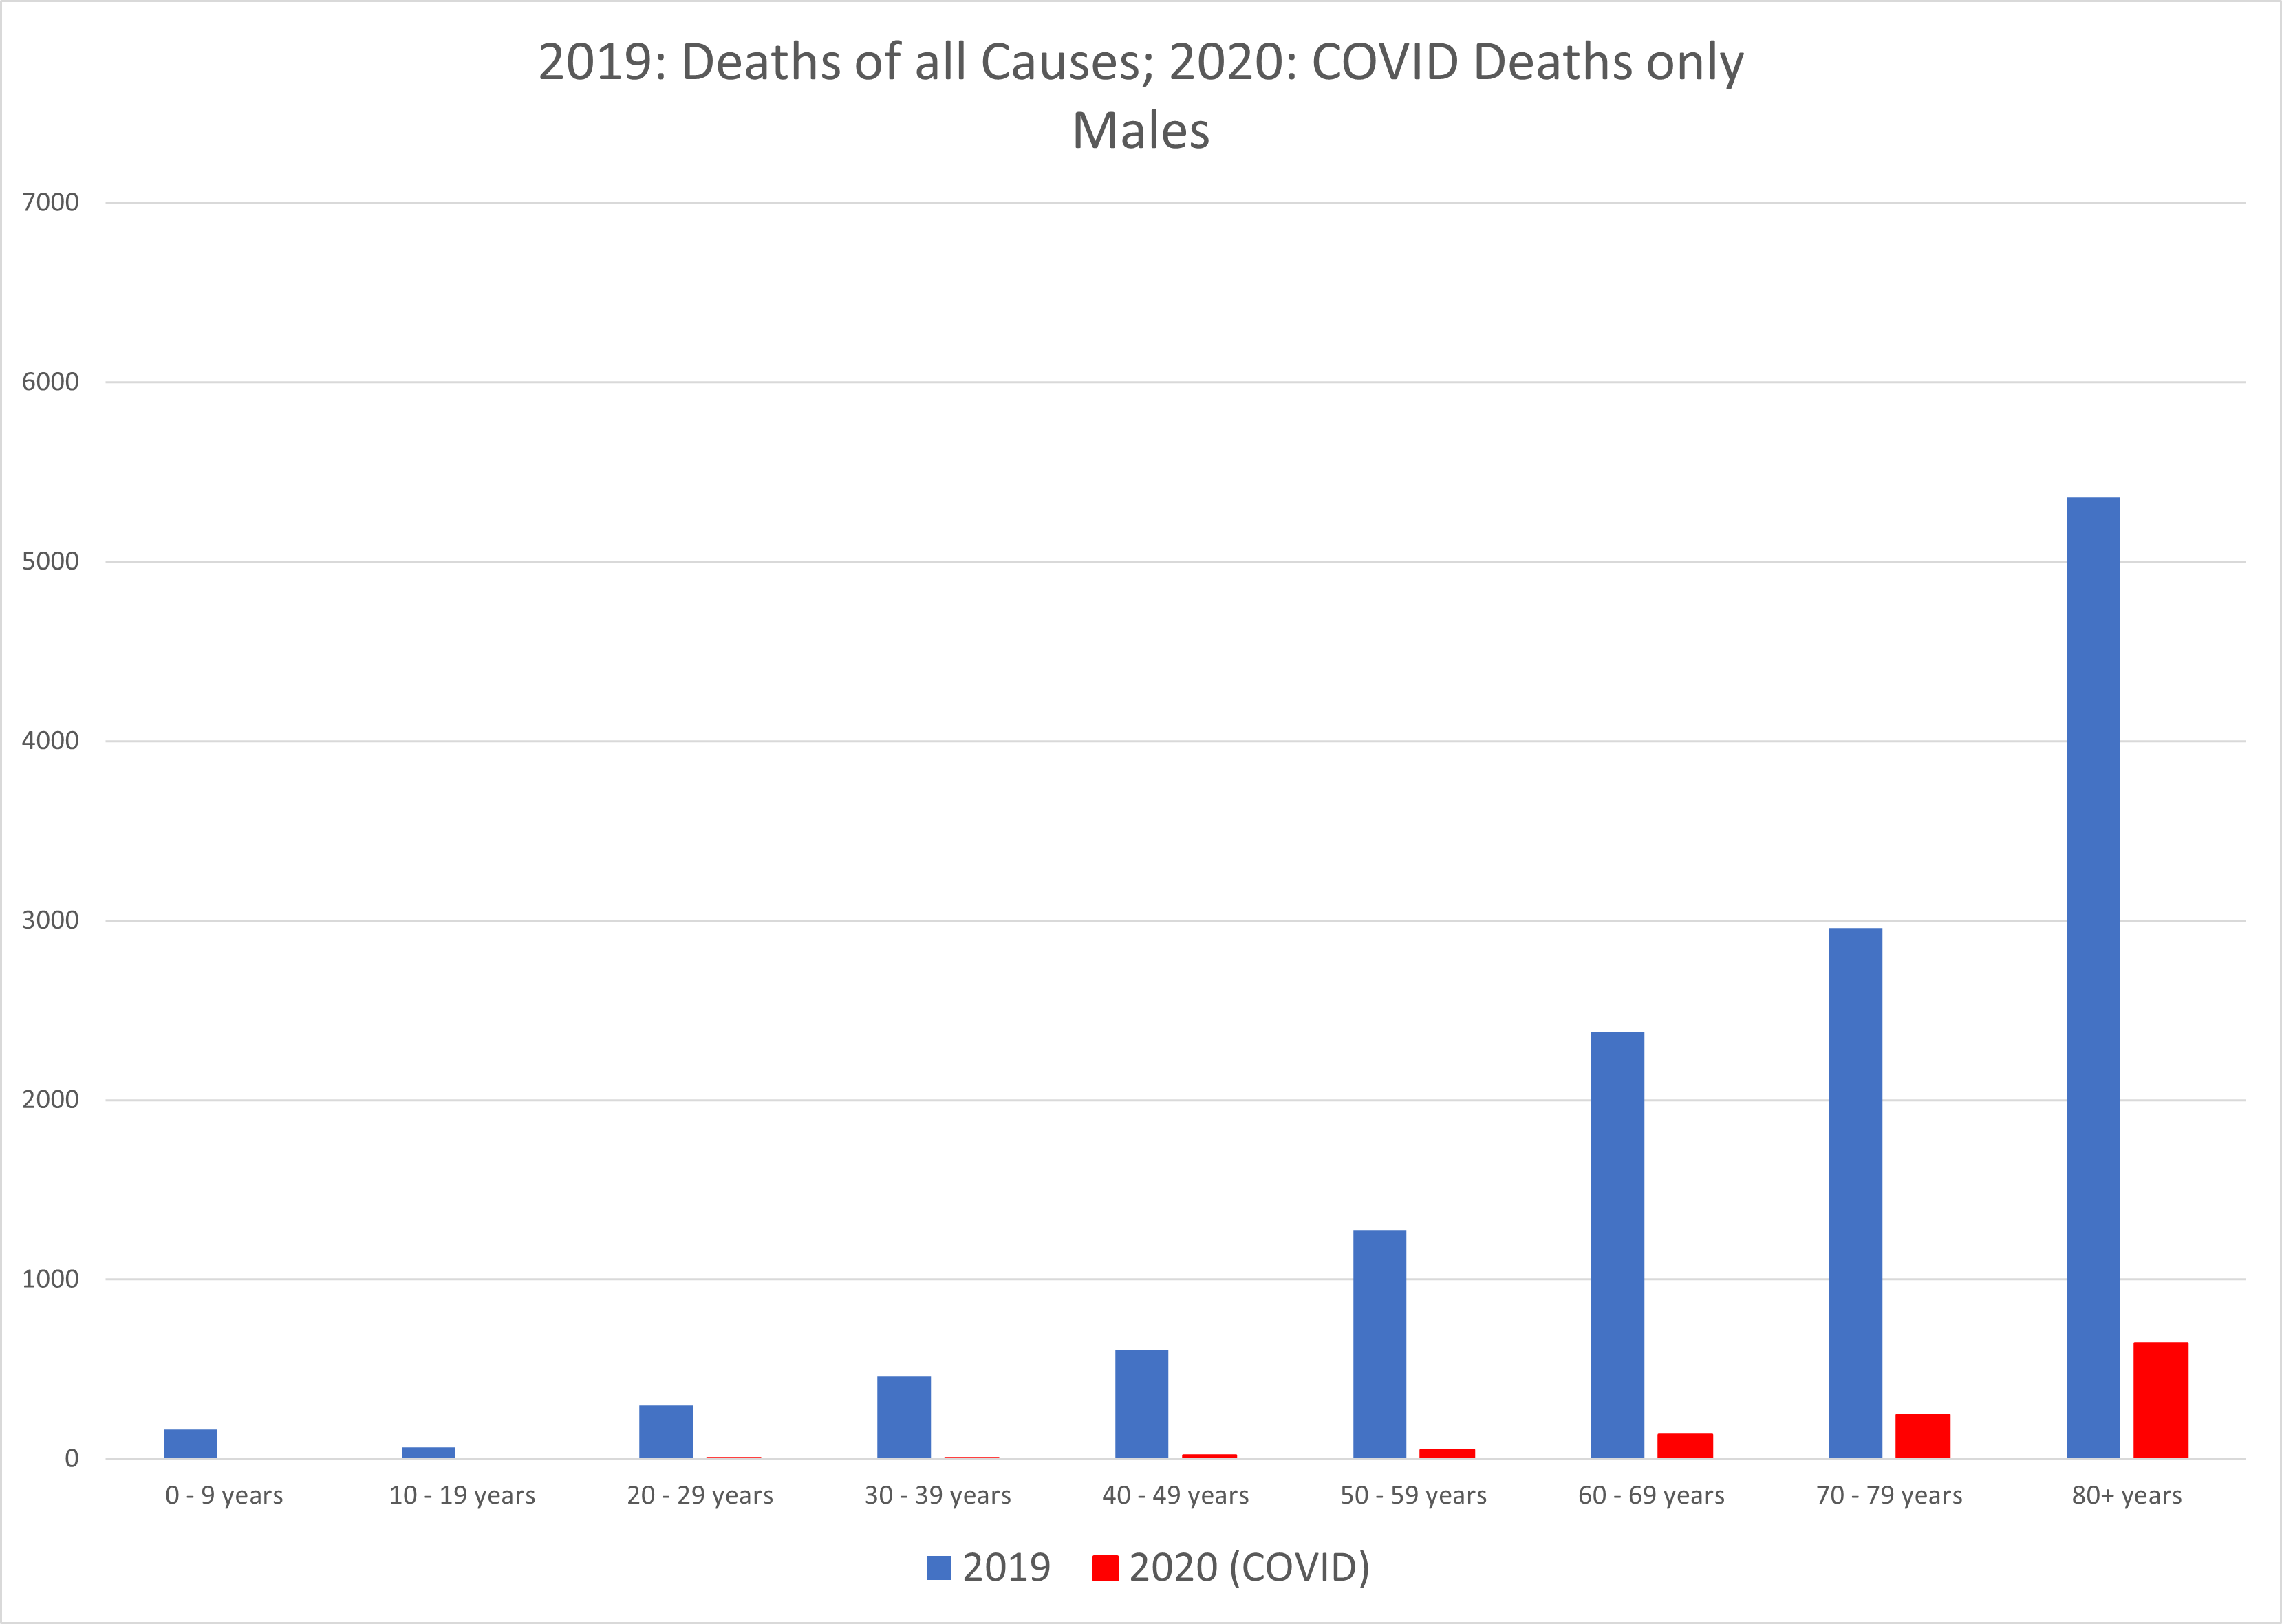
Graph 3: Deaths of all causes in 2019 compared with COVID deaths in 2020. Top: females; bottom: males.
We see from these graphs that COVID-19 deaths are overwhelmingly concentrated in the older age groups. The average age of death with COVID in Alberta is 81. Comparing all causes of death by age group between genders highlights the variation in death rates by age between men and women. Overall, men die in greater numbers in all age groups except the oldest one. Obviously, the greater numbers of surviving women will eventually die in the 80+ range. Men seem slightly more susceptible to succumbing to COVID at all ages.
What are the typical causes of death in each gender and age group? Graphs 4 and 5 show the 10 leading causes of death (excluding COVID) for the broader age groupings of 20-60 years and the over-60s, separately for men and women, per 100,000 per age group.
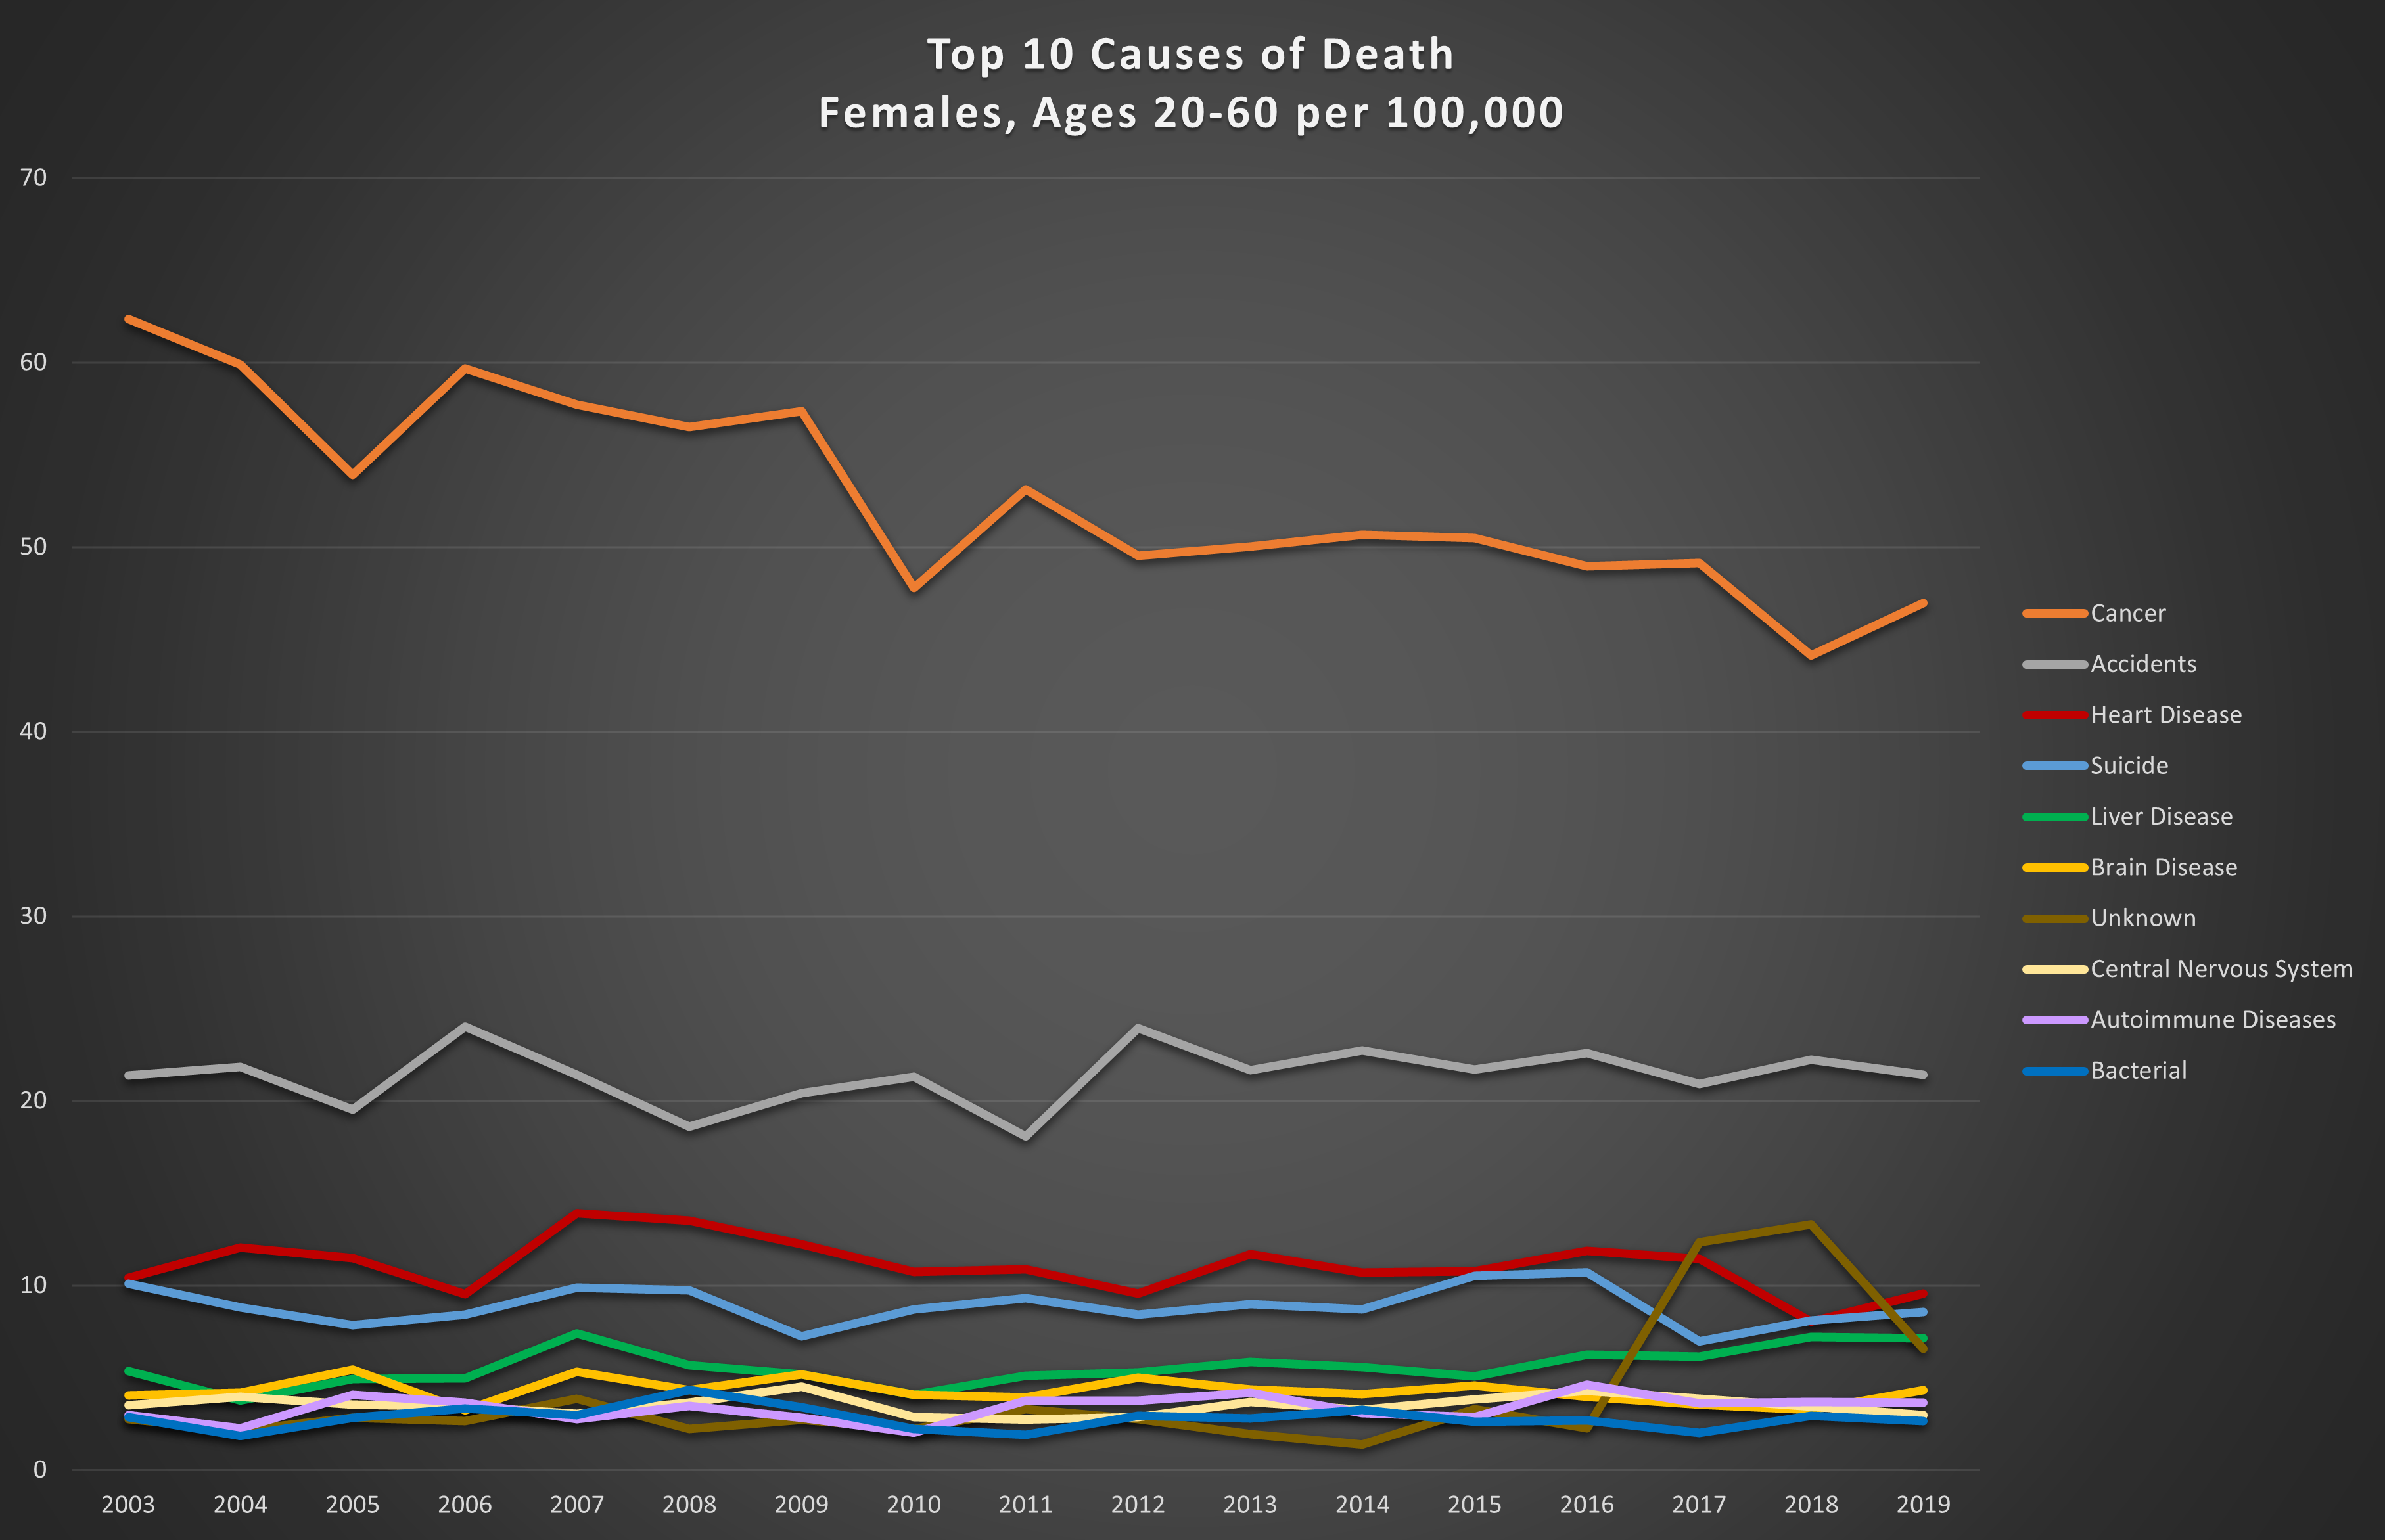
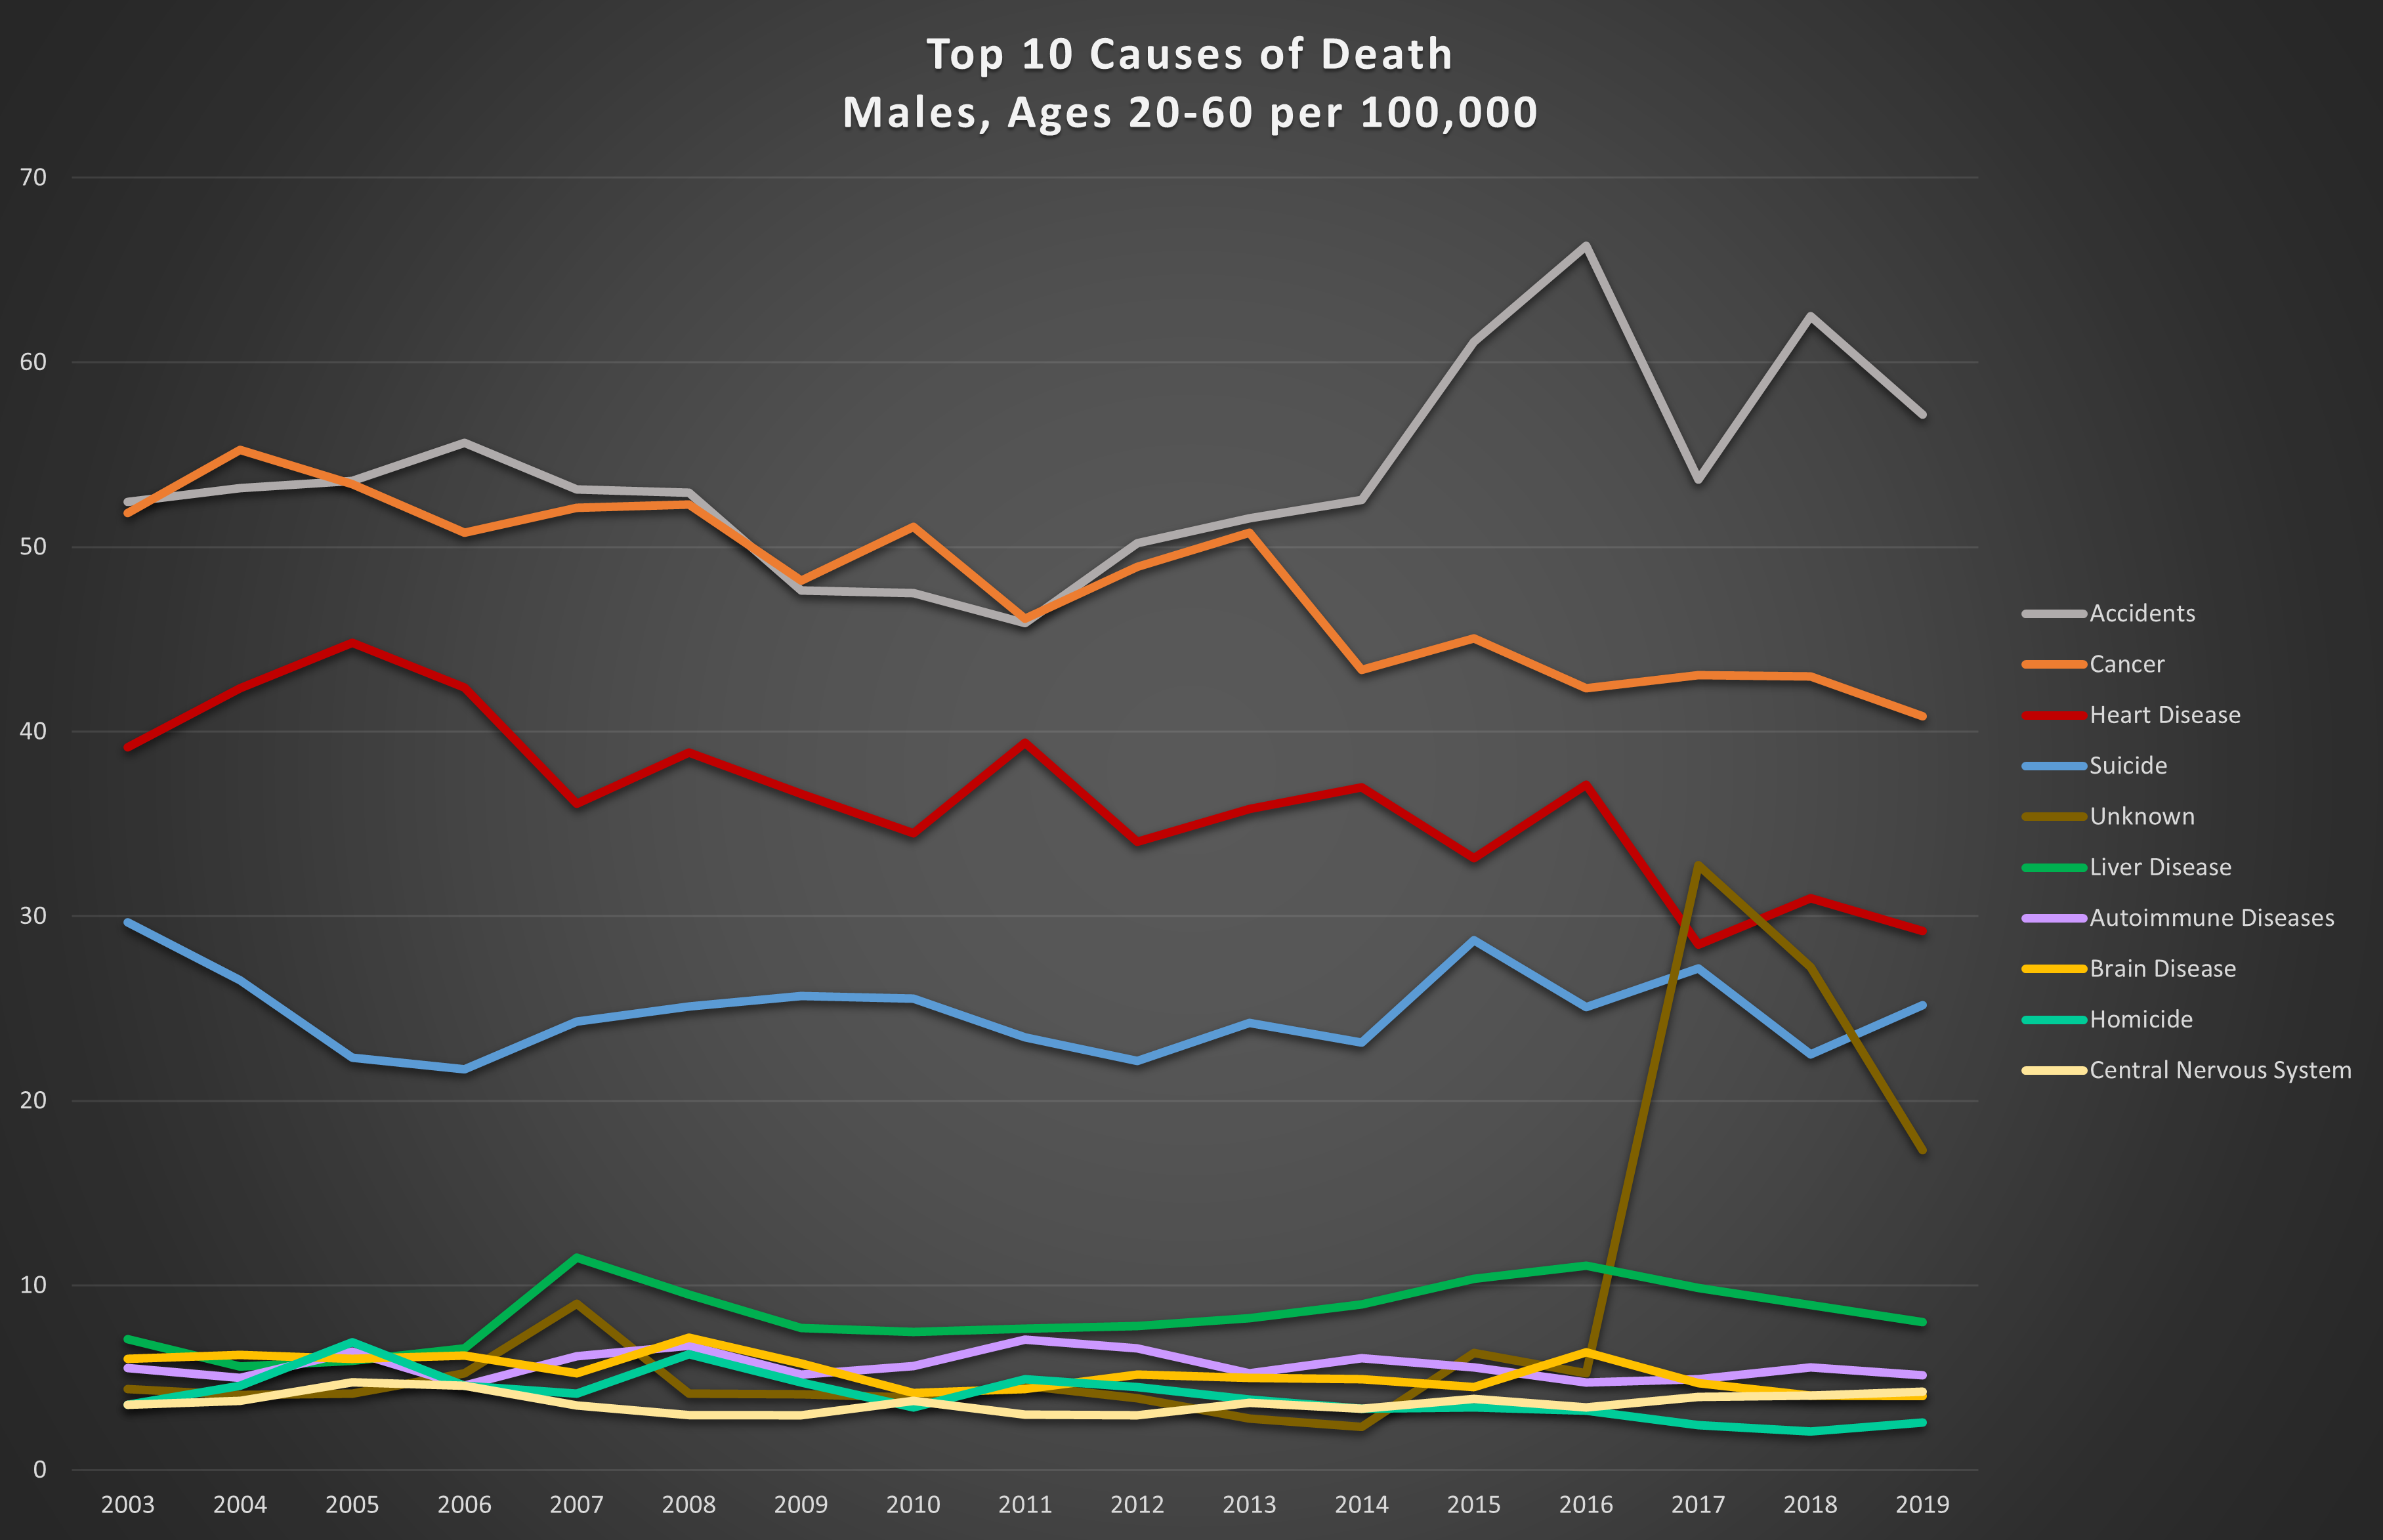
Graph 4: Top 10 causes of death in the 20-60 year age range per 100,000. Top: females; bottom: males.
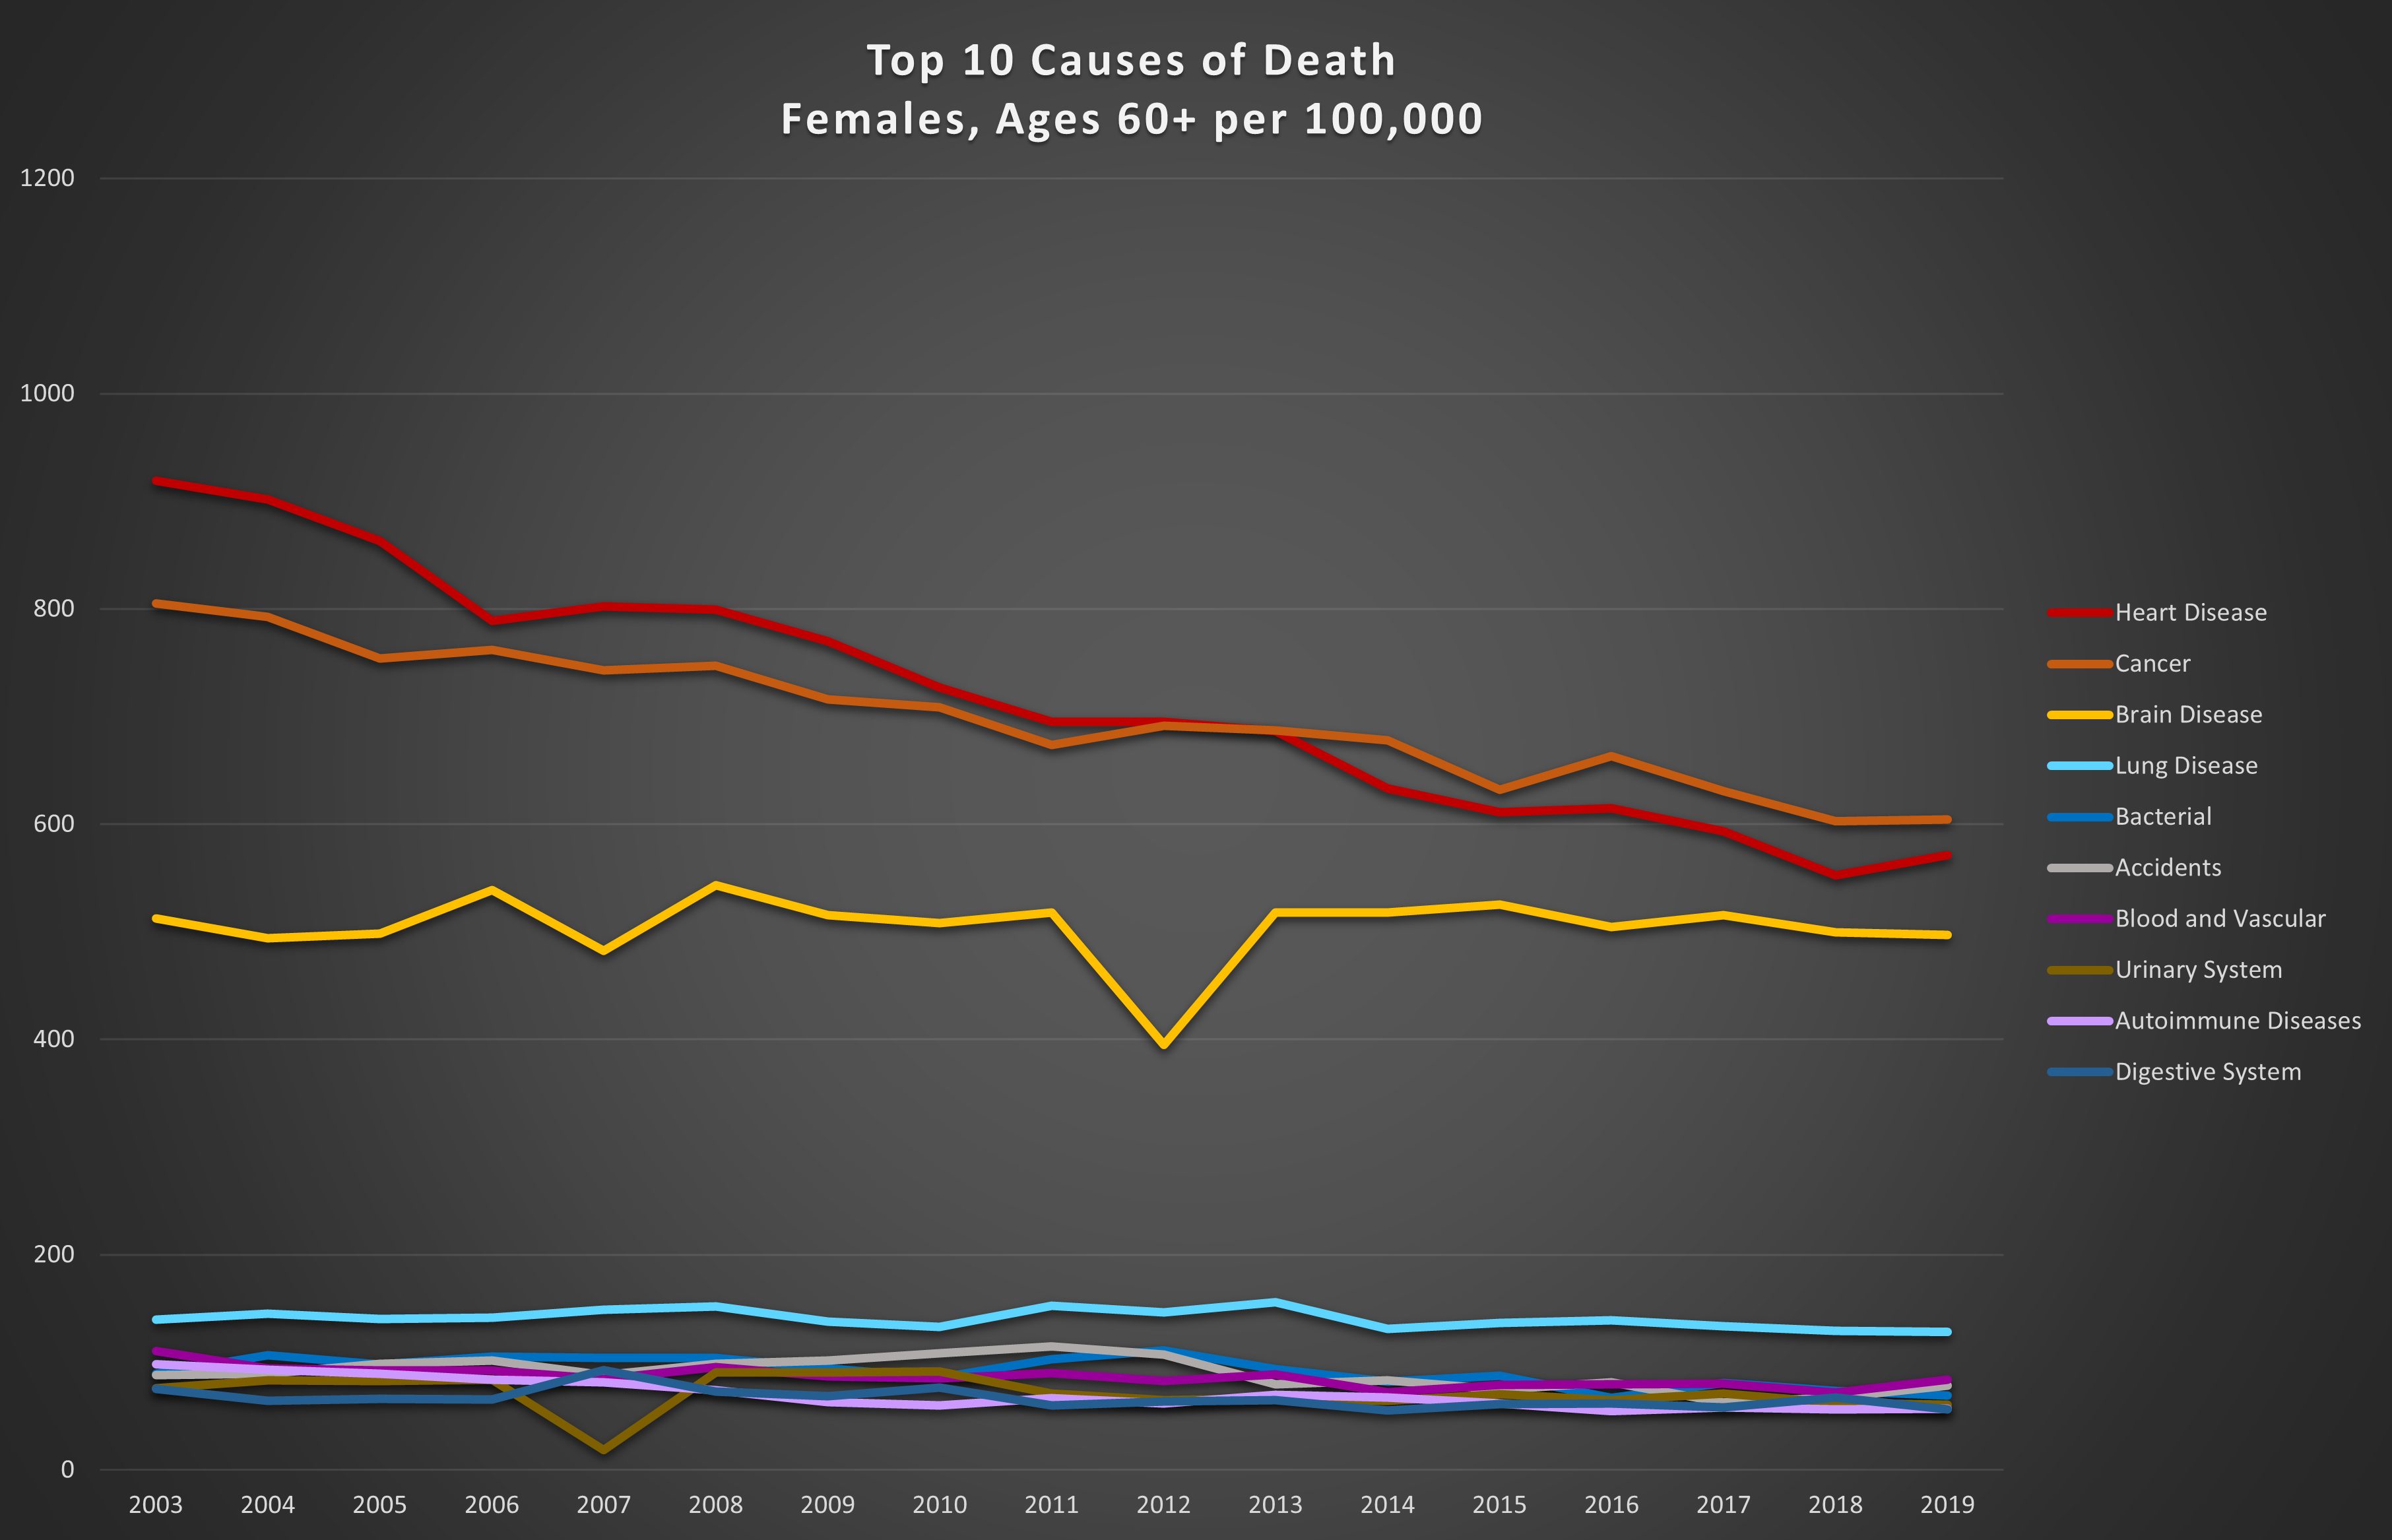
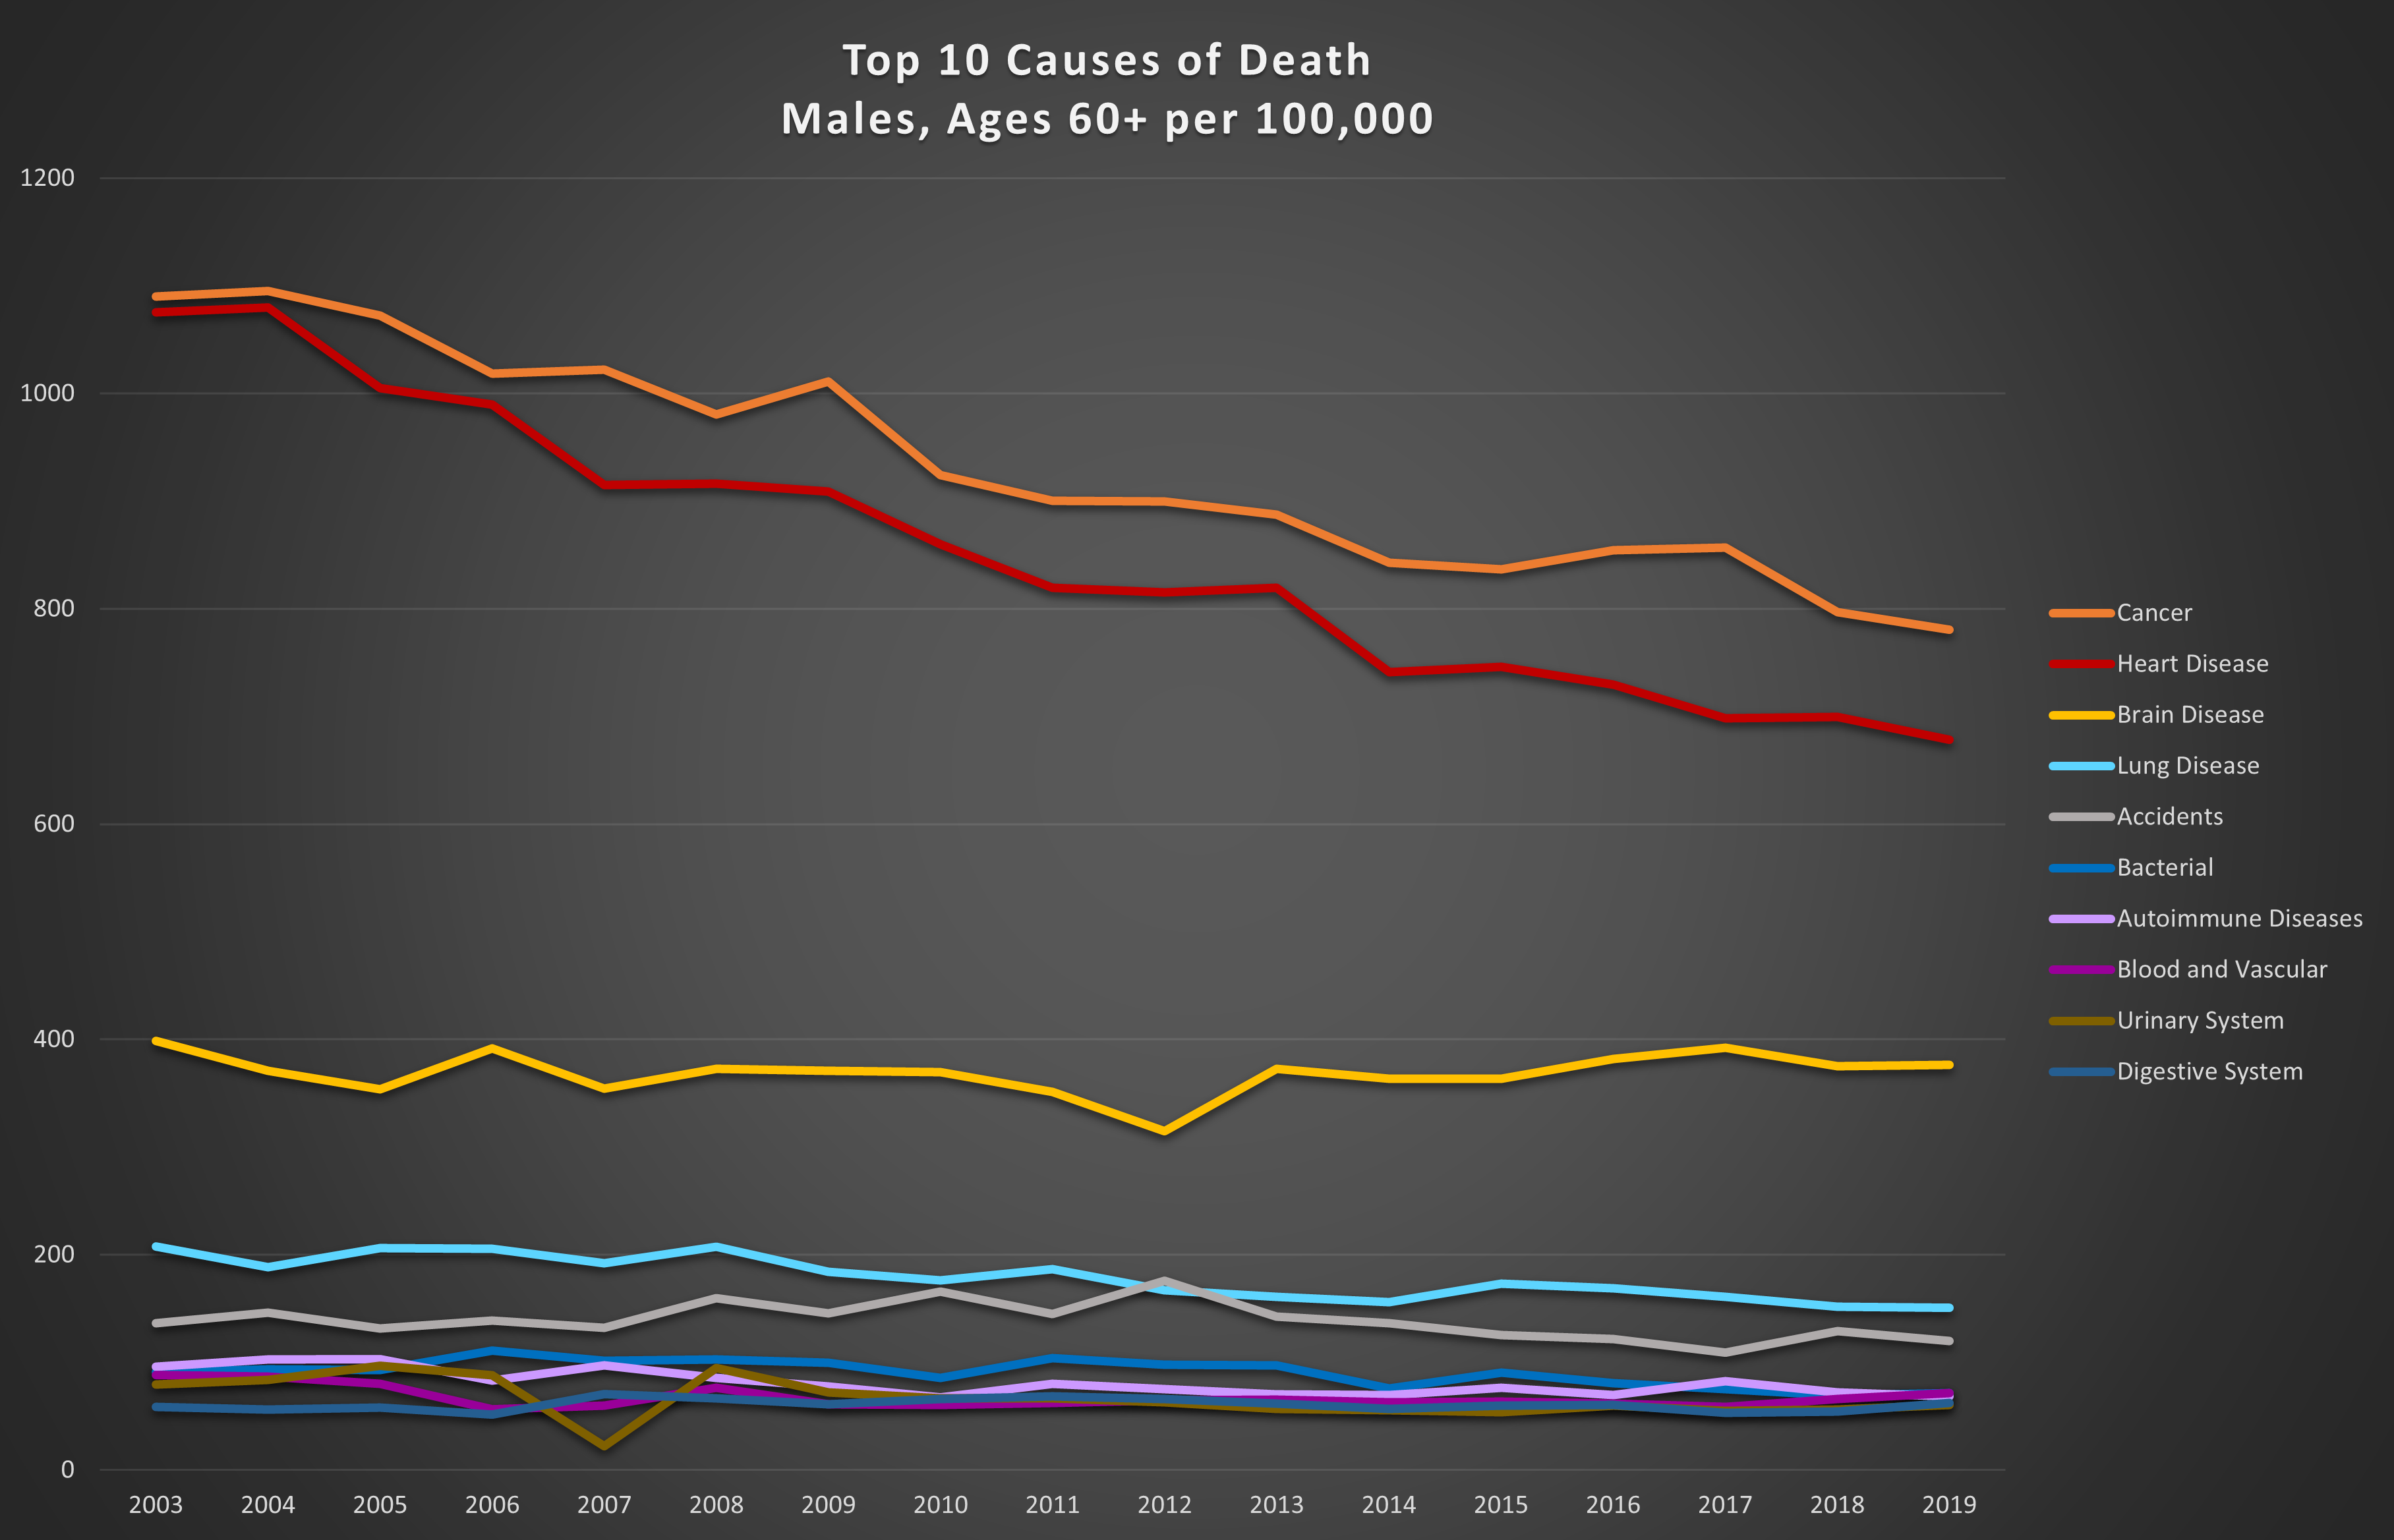
Graph 5: Top 10 causes of death in the 60+ age range per 100,000. Top: females; bottom: males.
The big killers in these age groups are cancer and heart disease. However, in younger men and women, accidents are much more significant. These trends are not surprising, since the longer we live, the more likely we are to contract life-threatening diseases, or for them to worsen. Also not entirely unexpected is the fact that in young men, accidents are almost always the leading cause of death. Factor in suicides and an average of 40% of male deaths between the ages of 20 and 60 are accidental or self-inflicted (26% for women).
The good news is that annual trends show steady reductions in death from cancer and heart disease meaning we are getting better at either preventing or treating these two prolific killers.
The obvious jump in “unknown” deaths between 2016 and 2017 in the 20-60 year age category highlights the uncertainty that is inherent in any large dataset relying on inputs from multiple sources. Each of the entries in the raw data represents, in many cases, a transcription of hand-written information from a hospital or a coroner. In the analysis of any data, we must be aware that even in the best datasets, there are deficiencies, errors, gaps, mis-labeling, and inconsistencies.
So, how does COVID-19 fit in to this picture we now have of other causes of death? Looking at the leading causes of death for each gender and age group in 2019, we can place the 2020 COVID deaths in relative order. Adjusted for population differences between 2019 and 2020, Graphs 6 and 7 illustrate the fatality levels of COVID-19 among women and men, young and old.
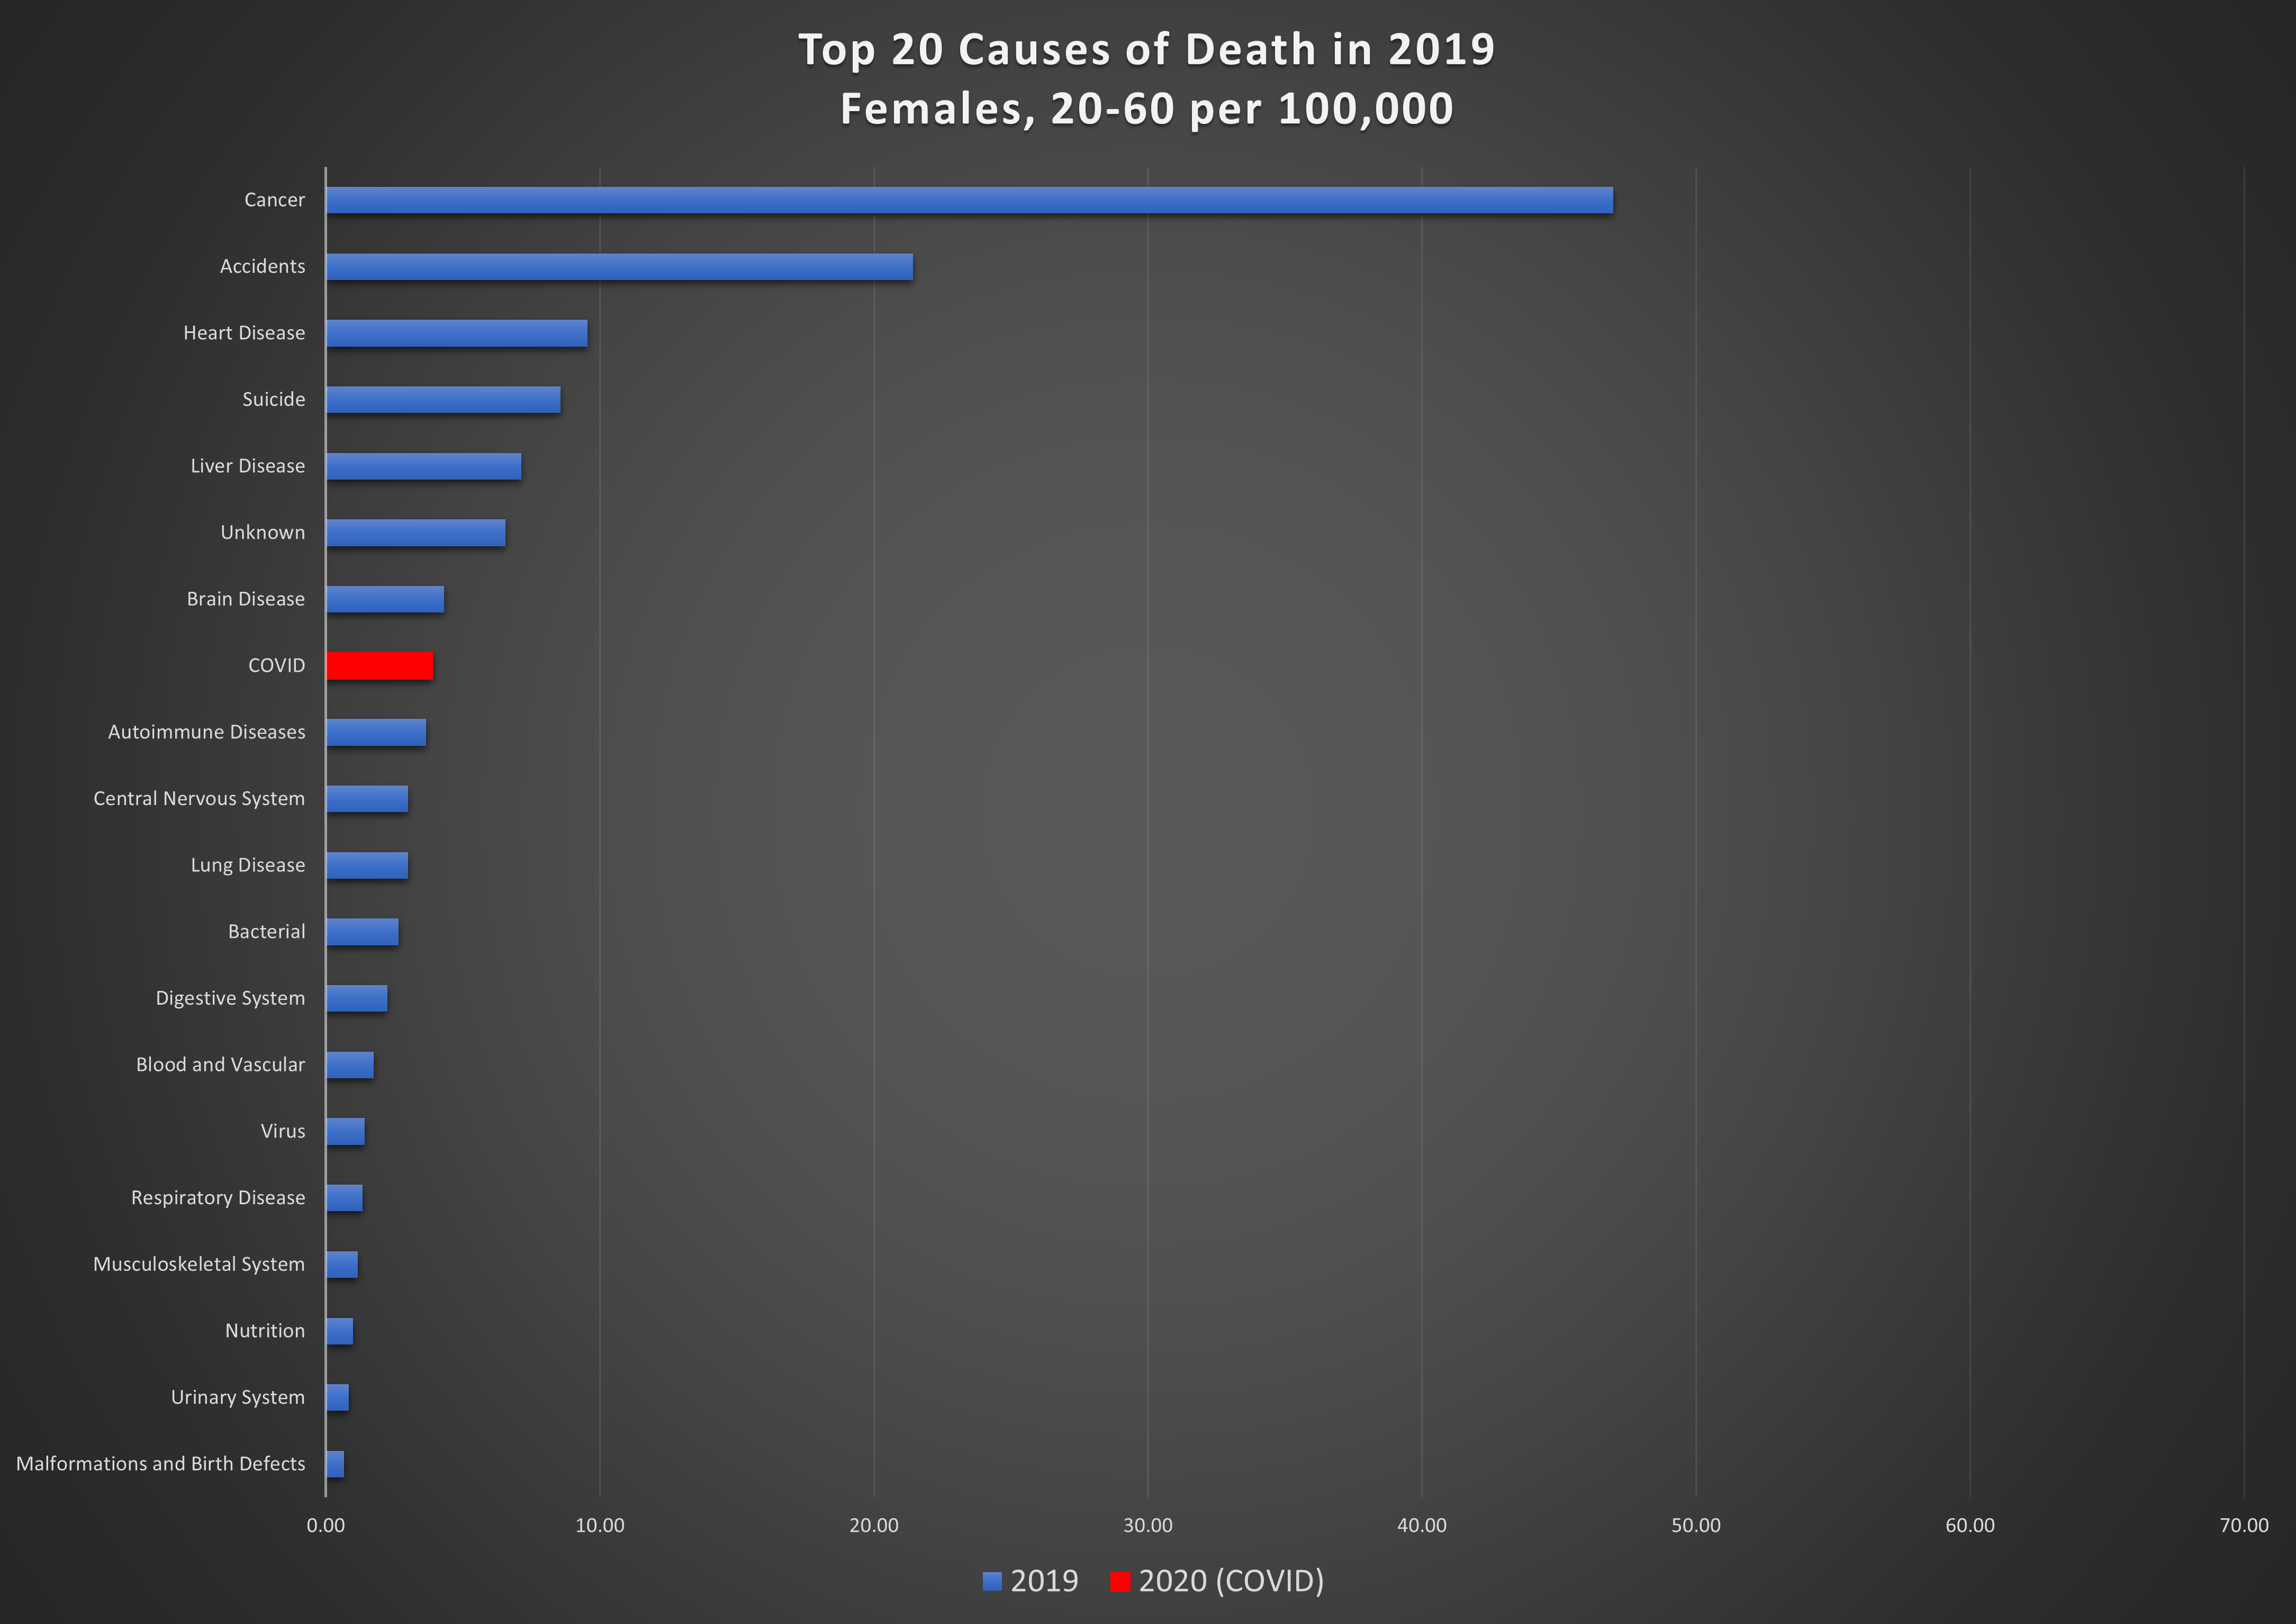
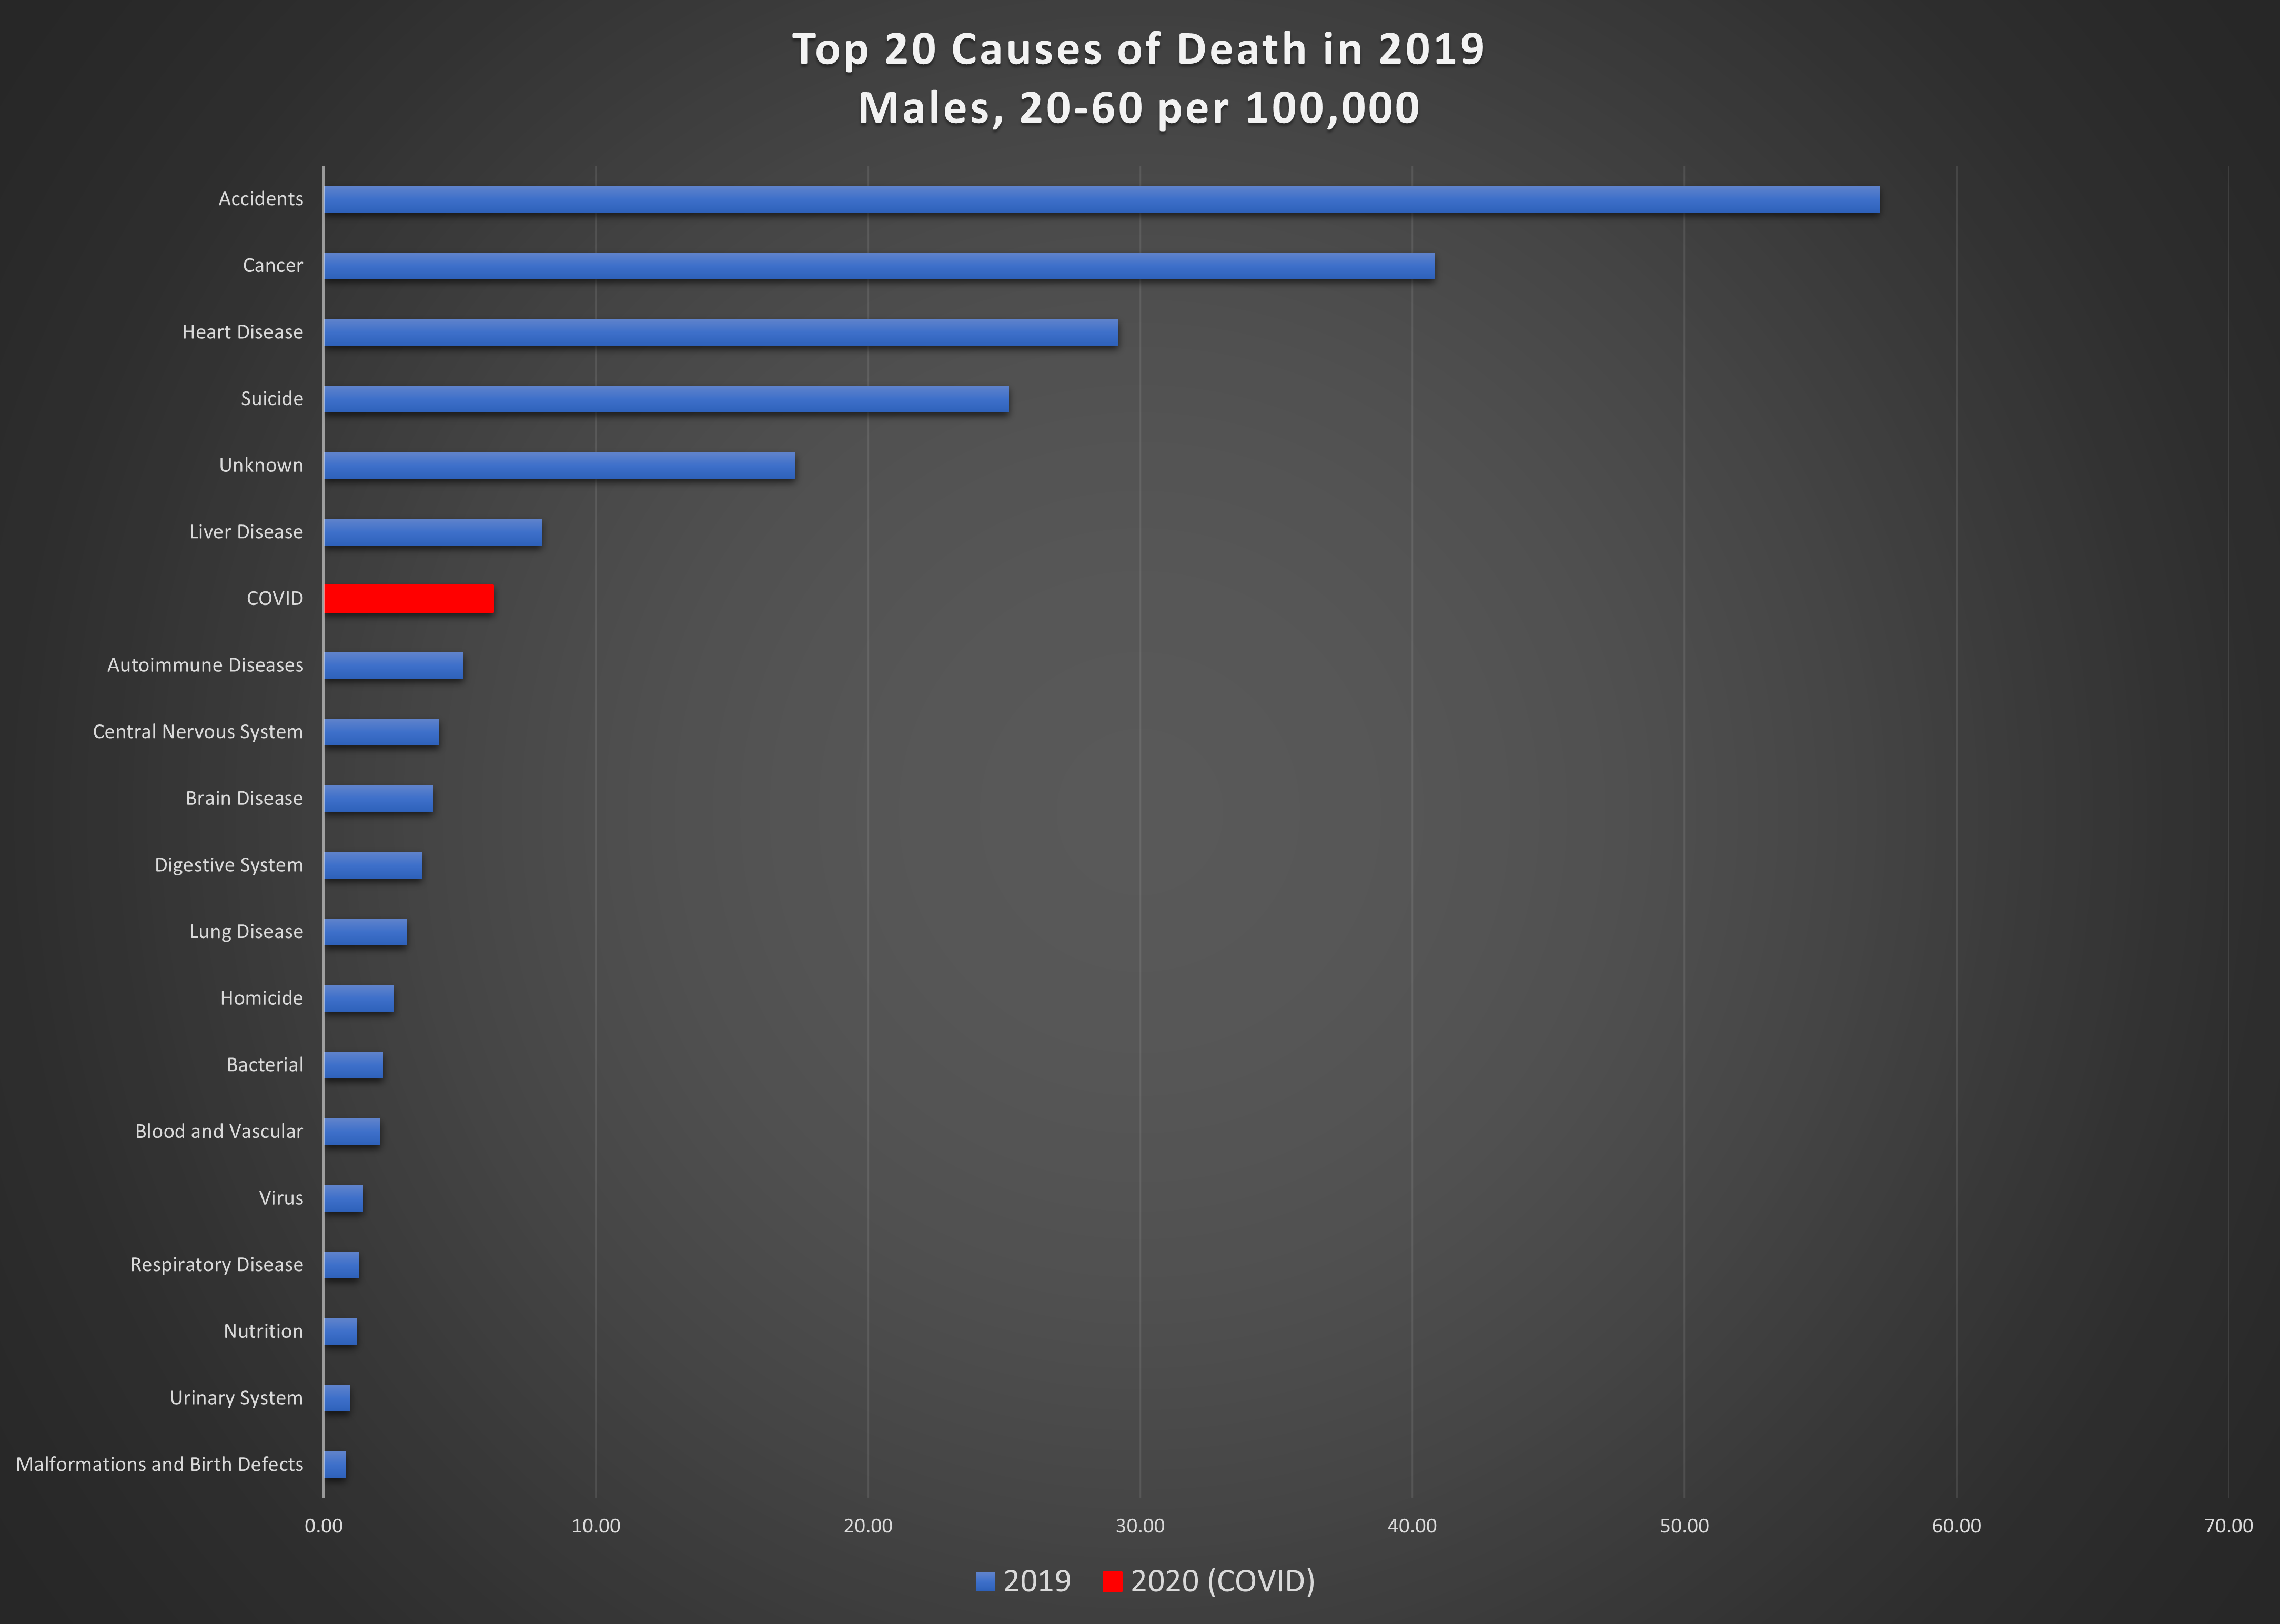
Graph 6: Top 20 causes of death per 100,000 in 2019 and COVID in 2020, in the 20-60 year age group. Top: females; bottom: males.
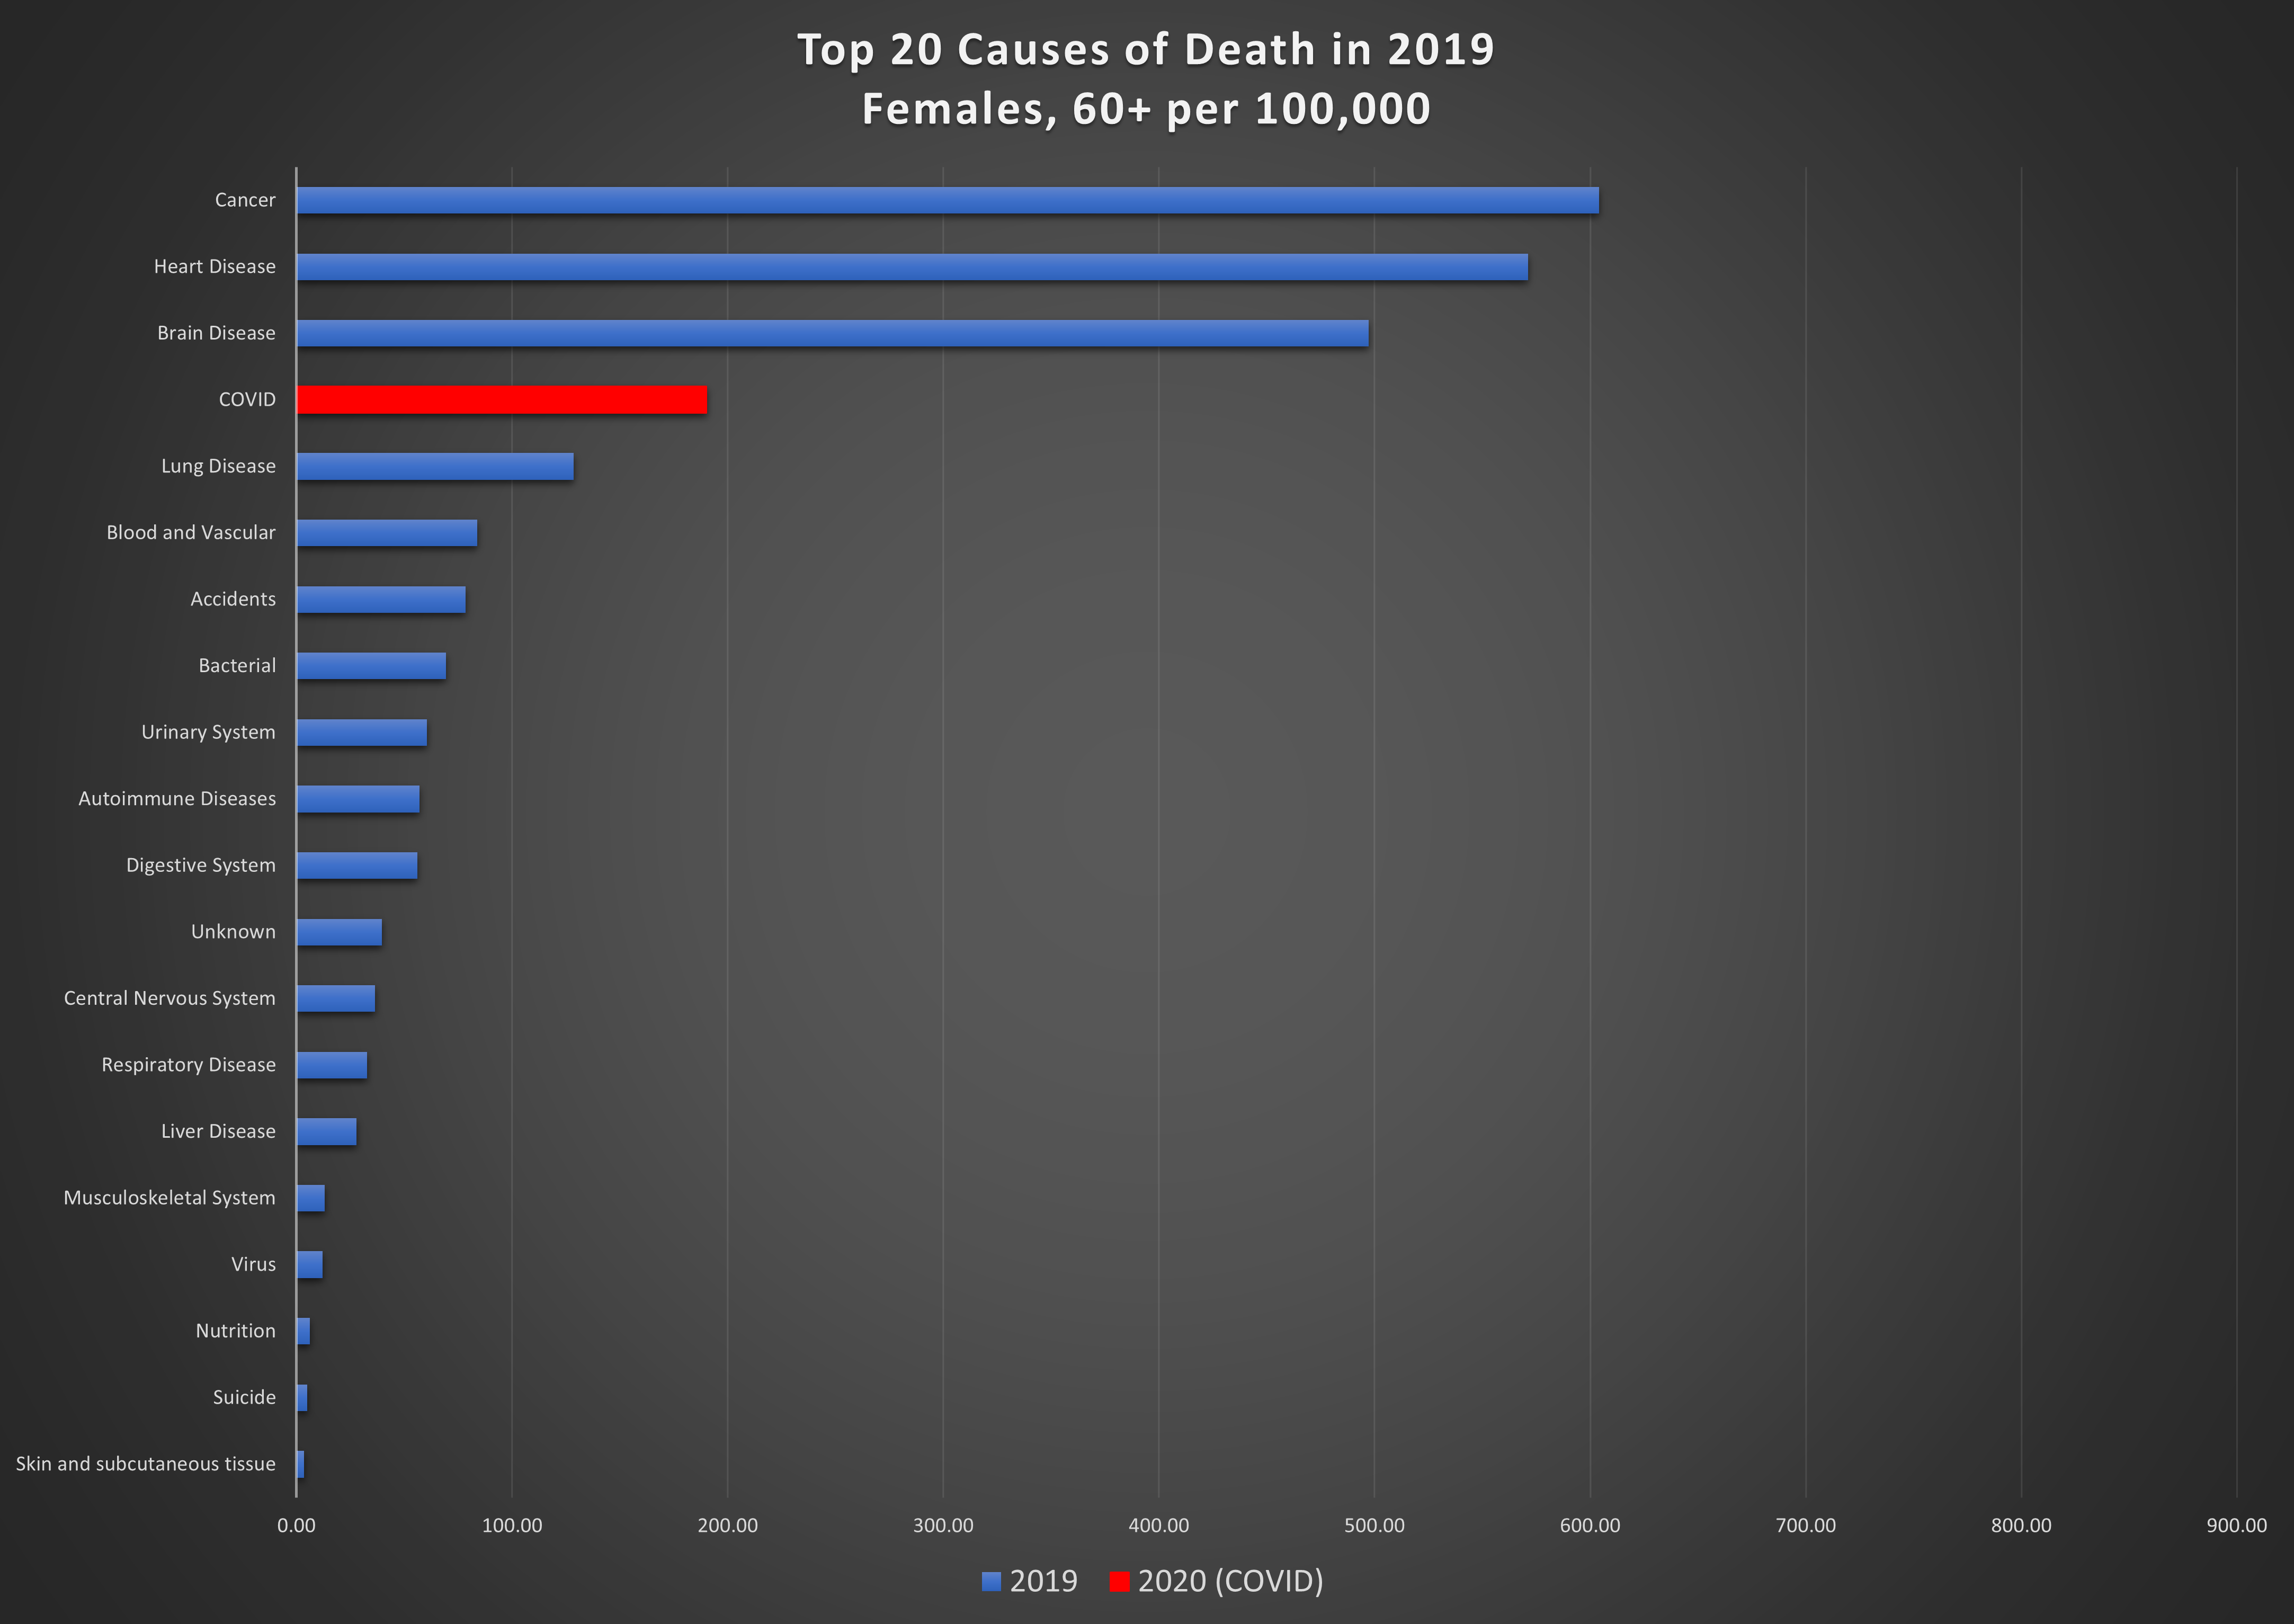
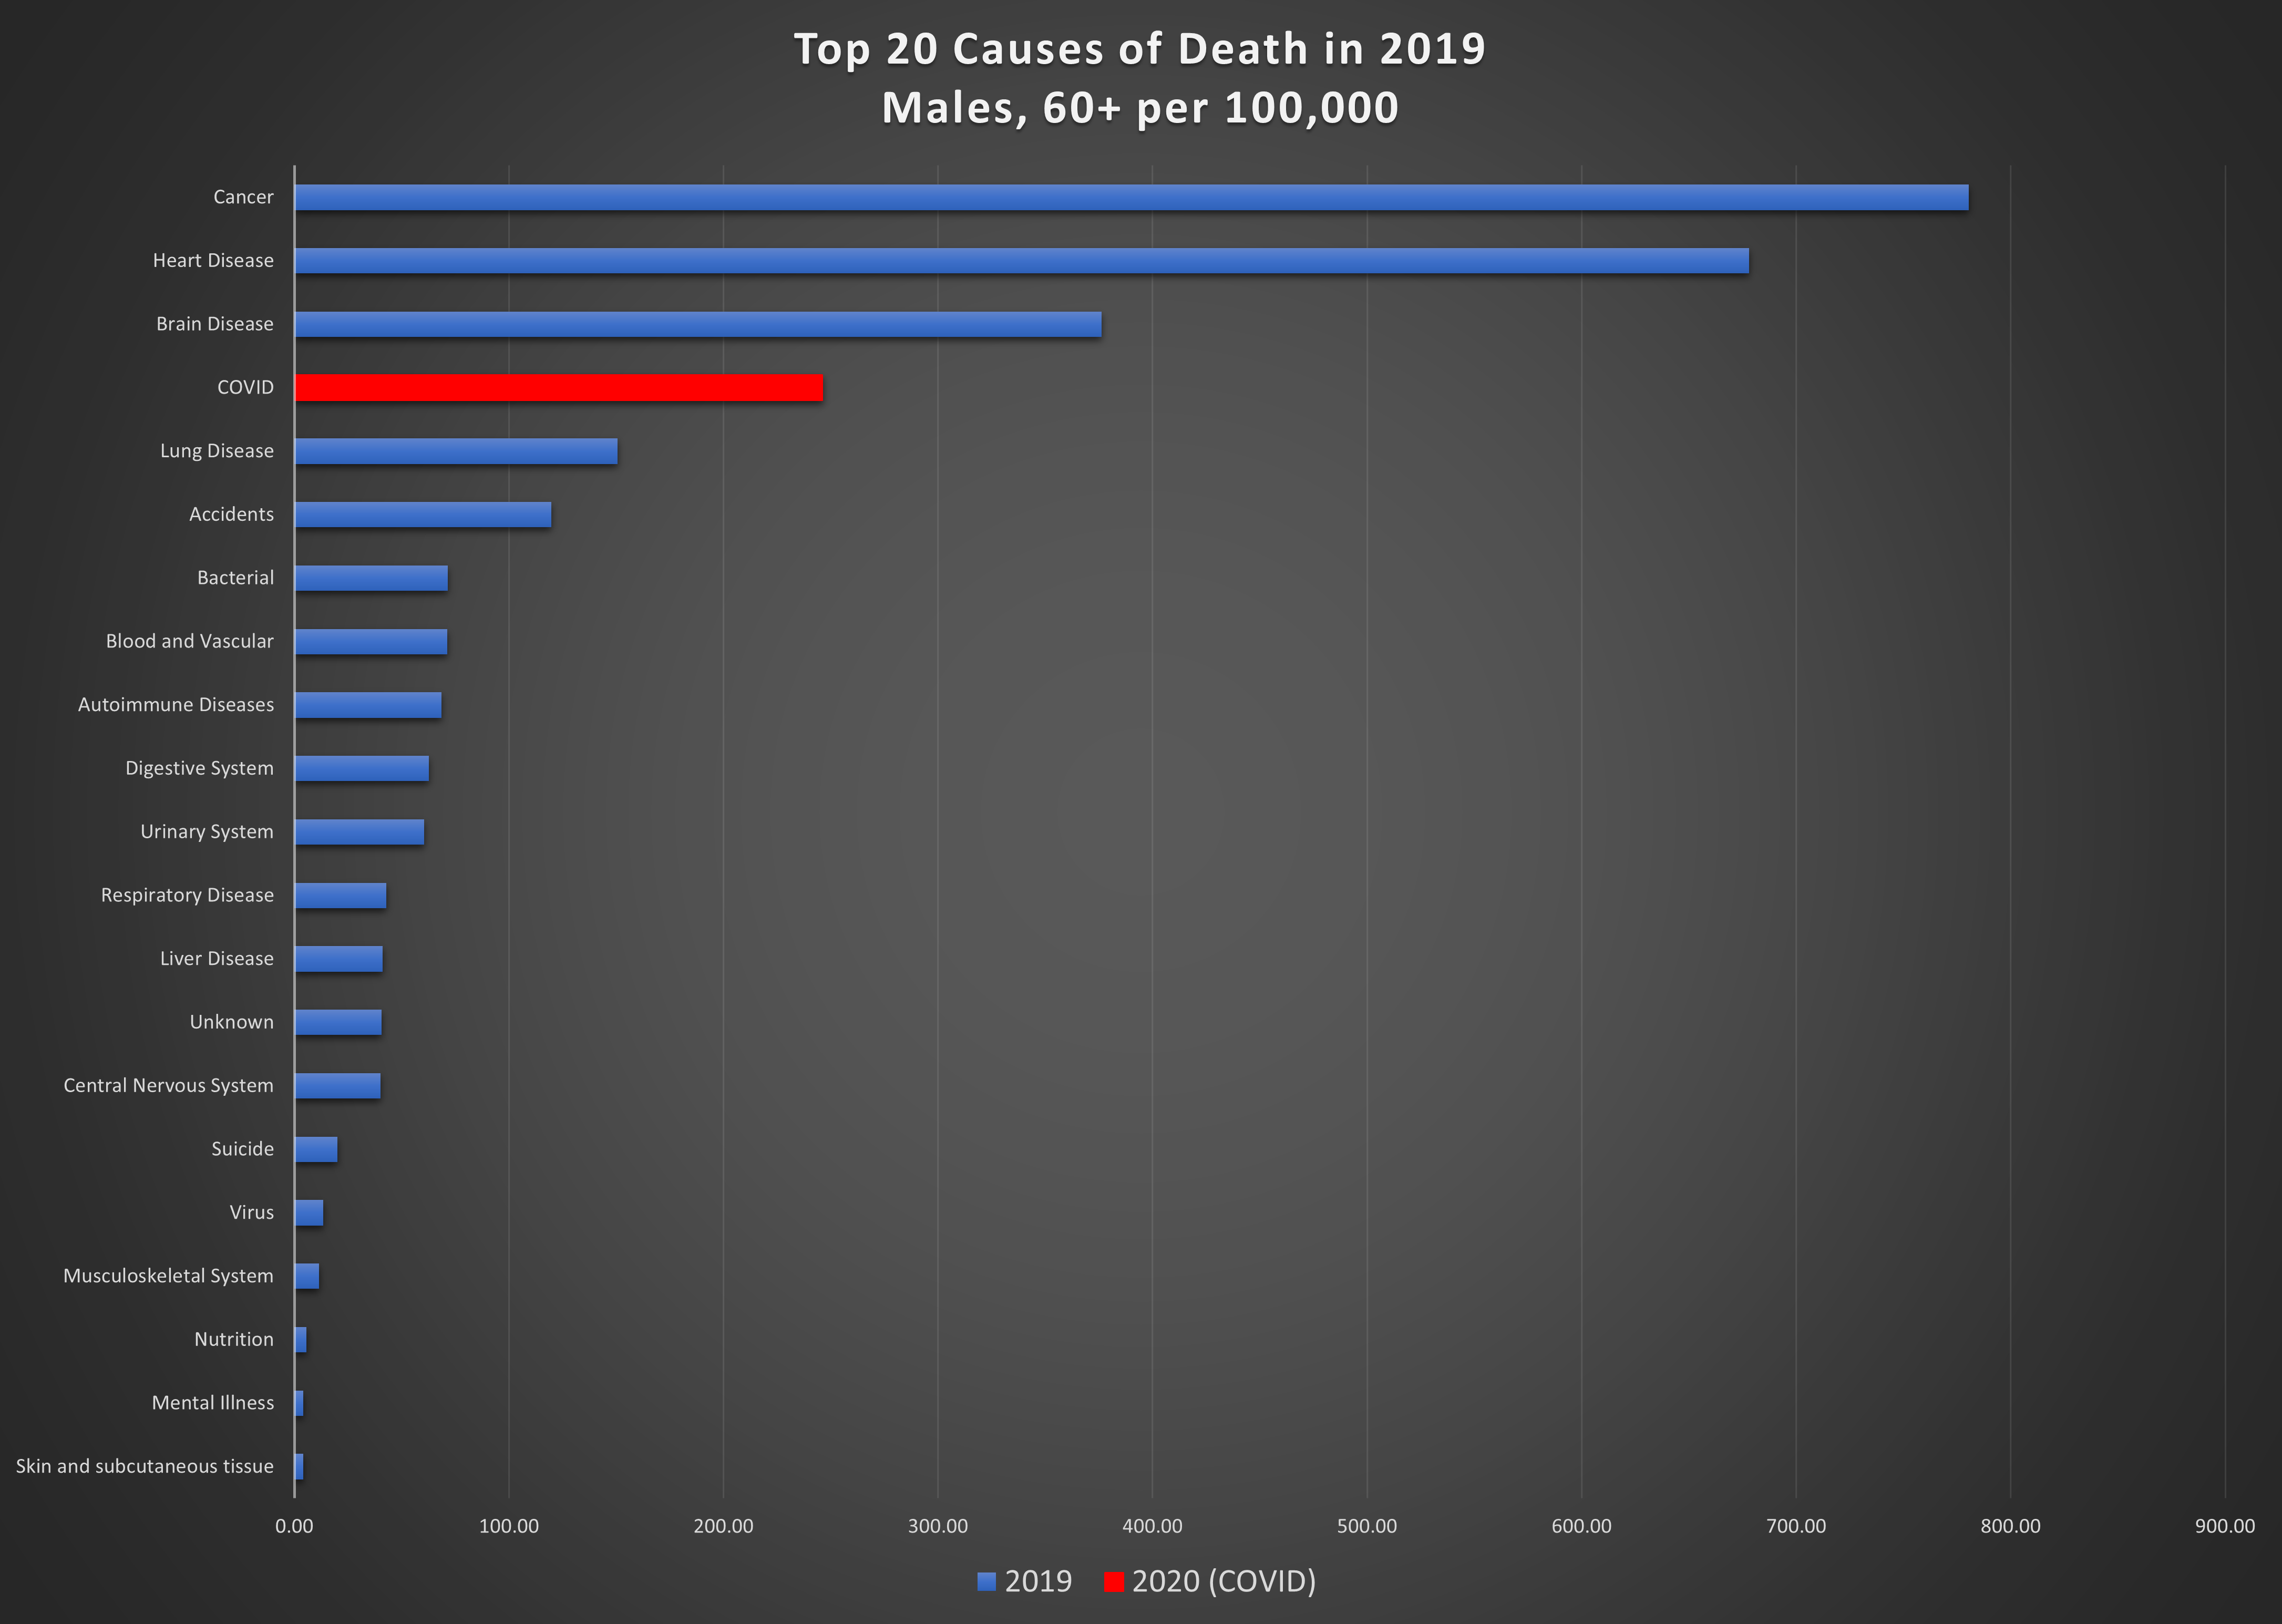
Graph 7: Top 20 causes of death per 100,000 in 2019 and COVID in 2020, in the 60+ age group. Top: females; bottom: males.
Men aged 60 and over are the hardest hit from this virus; it is the 4th highest cause of death in this group, killing 246 per 100,000. Among women in this age group, 190 per 100,000 succumbed to COVID. The leading cause of death for women in the 20-60 age group is cancer, by a wide margin, killing 47 per 100,000. COVID is eighth on the list, causing death in 4 per 100,000. COVID is also not a major cause of death for men in the 20-60 age group, resulting in 6 deaths per 100,000.
Excess deaths
So far, these morbid comparisons have all been between a world that was unaffected by COVID-19 (2001 to 2019) and deaths attributed to COVID-19. What would we have expected for deaths in 2020 in the absence of COVID? This can be estimated by examining trends and extrapolating them statistically.
Graph 8 shows the total number of deaths per 100,000 from all causes in the 20-60 year age group and the over-60 age group, for men and women on the same chart. 2001 to 2019 are actual values, while the 2020 point is an estimate based on a “least-squares” average of the previous five years.
For example, the predicted number of deaths per 100,000 in 2020 for females in the 20-60 year age group is 129.3. The standard deviation (uncertainty) in this estimate is 2.1. This means that it is reasonable to expect the number of deaths to be anywhere between 127.2 and 131.4. Anything outside this range would be considered “excess” (positive or negative). The actual number of deaths attributed to COVID in that age and gender group is 4, which is on the order of the uncertainty range.
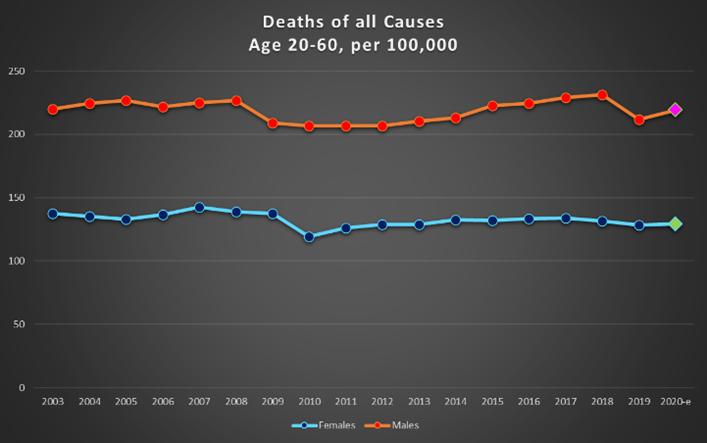
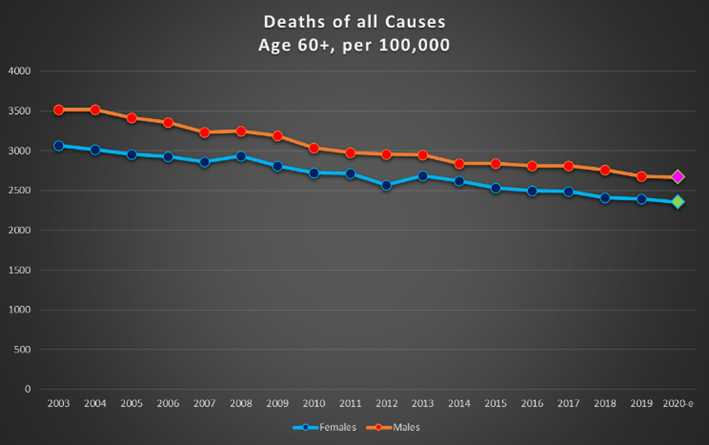
Graph 8: Deaths per 100,000 of all causes for females and males on the same chart. Top : ages 20-60; bottom: over 60.
Statistical processes are prone to “selection bias”. The estimated 2020 points on the charts in Graph 8 represent, as mentioned, the trend determined by the previous five years of data. If we instead chose the previous 10 years of data, the estimated 2020 value would have been 134.8 plus or minus 4.2. Choosing the previous three years of data as the baseline would have resulted in 125.7 plus or minus 3.2. The table below shows the variation in predictions resulting from the selection of baseline data.

These predictions are all based on extrapolations of “normal” conditions. 2020 was anything but normal. Aside from the direct impacts of COVID-19, there were also significant deviations from normal behaviour due to the response to the virus, which may influence the deathscape in ways not anticipated or documented. We cannot speculate on what would have resulted had these responses been different: no lockdown, longer or more severe lockdowns, different timing or severity of travel restrictions; these are all alternate realities that will never be experienced but may have led to different outcomes entirely.
The longer-term and longer-lasting effects of COVID-19 remain to be seen. There are many additional and unpredictable factors related to the effect of vaccinations, virus variants, and medical resources, surprises, and breakthroughs. Data will continue to be gathered and analysed to try to explain, understand, and predict.
It is not immediately obvious how deeply lives will be affected by this strange and uncertain global episode. However, as we respond to the continuing developments in this story, we should keep in mind that life is about so much more than simply the avoidance of death.
[1] By “gender”, we mean males and females as specified in the original data. Broader gender groups were not explicitly distinguished.
[2] https://open.alberta.ca/dataset/4481915f-aab6-4726-9a4f-9f2c1c457e7c/resource/0e420902-e5e7-4fc4-af2a-5fd826c17d33/download/deaths-by-gender-and-age00xlsx.xlsx
[3] COVID-19 Alberta statistics | alberta.ca
[4] Coronavirus COVID-19 (2019-nCoV) (arcgis.com) – dashboard created by Johns Hopkins University: JHU CSSE – Center For Systems Science and Engineering at JHU, with methodology described in: An interactive web-based dashboard to track COVID-19 in real time – The Lancet Infectious Diseases
[5] https://www150.statcan.gc.ca/t1/tbl1/en/tv.action?pid=1710000901 , https://doi.org/10.25318/1710000901-eng
[6] COVID-19 Alberta statistics | alberta.ca
(Laurie Weston – BIG Media Ltd., 2021)


A nice piece putting CoVid statistics in perspective. Where do drug overdose deaths get counted. If it is counted as an accident it may explain the high numbers in the 20 to 60 age group.
Thanks, Andre. Your assumption is correct – drug overdoses are included in accidents in this analysis. We have not sub-categorized accidents to compare relative proportions within this group, but it will be interesting to see how it breaks down.
Nice analysis, Laurie. Excess deaths is a good metric for this problem. You touched on a lot of interesting points there. The cancer, accident, and suicide numbers are well worth additional discussion.
RE COVID, I can’t help but wonder what the outcome in excess deaths would have been had we not behaved as we did. That is, if we had stayed open, no masks, etc. This would be an awful problem to try to estimate. As you are well aware, describing data in the a posterior is difficult enough, but to run “what if” scenarios is much less certain. As it is, the excess death numbers have been very low due to COVID, in a statistical sense, and we all as individuals know how we feel about the last year. Knowing what might have happened if our response had been different … well that is a whole other topic, and a speculative one at that especially considering variants with different Ro.
Great work.
Thanks for your comments, Lee. As we were looking at the data for this article, we realized there were many storylines to follow, not just COVID. COVID, of course, is a complex and ongoing one, even without trying to imagine all the “what if’s”!