Although new cases of COVID in Canada and the United States are dropping, as of January 31, 2022, the United States had 29,124,466 reported active cases of COVID, and Canada had 209,358 active cases[1]Moreover, a tremendous number of booster doses of COVID vaccines have been delivered to address this surge in new cases. The United States has delivered 88.15 million doses of the booster, while Canada has delivered 15.59 million doses.[2]All of these boosters are either of the Pfizer or Moderna mRNA booster.[3]
We have been reporting on the highly infectious Omicron variant in a number of articles, with particular interest in Omicron’s severity. Our latest article – The best missed prediction: disease severity 50% lower than we predicted – suggested that Omicron’s severity, as measure by ICU level outcomes, could be as low as 12% that of the Delta variant for vaccinated persons. While vaccine manufacturers such as Moderna claim that their booster should be effective against the Omicron strain, this article takes real world data from Alberta, Canada, to estimate the vaccine effectiveness (VE) of the boosters against ICU severity outcomes and non-ICU hospitalization.[4]
Evaluating vaccine effectiveness
We discussed VE in a series of previous articles, including Understanding vaccine effectiveness and breakthrough. Evaluating VE for a booster has unique challenges, so we should review the method and choices that must be made within it.
As mentioned in Understanding vaccine effectiveness and breakthrough, VE is a relative measure, defined as, “The percentage reduction in the incidence of disease among vaccinated persons compared with unvaccinated persons.”[5]This measure is not, therefore, an absolute measure; it is relative, and is self-scaled.
We use the screening method to estimate VE, which is defined by:
This method requires the following data from public health sources:
- The proportion of vaccinated amongst the cases, PCV, also known as breakthrough cases.
- The proportion of unvaccinated amongst the cases, PCU or 1-PCV.
- The proportion of the population that was considered vaccinated, PPV, during that study period.
The assumptions of the screening method
When a vaccine trial is undertaken, specific effort is made to choose a randomized cohort of participants that statistically represents the population to be vaccinated. This will include various medically relevant factors, often including age, sex, body-mass-index, comorbidities, ethnicity, and other variables. The measure coming out of such a control study is termed “vaccine efficacy” and is considered more accurate than the mathematically equivalent vaccine effectiveness estimates coming from the screening method, which generally does not guarantee control over the statistical populations.[7]
The assumption within the screening method is that the vaccinated group and the unvaccinated groups belong to the same population. By population, we mean same or very similar age groups, sex, general health, and other medically relevant factors. If this assumption is not valid, the results may be skewed or may themselves not be valid.
In other studies we have discussed, such as this article on adverse events – Analysis of severe events following COVID vaccine shows increased incidence of myocarditis and lymphadenopathy – control over population matching was handled with care, and is no less a factor here.
We studied the entire population and the 12+ age population and found that using the 12+ population mitigated the largest demographic bias.
Special challenges with estimating the VE for a booster
As discussed in Understanding vaccine effectiveness and breakthrough, we define what we are comparing VE for. We could be discussing VE against new cases, against death, or against ICU-level of care. Once this decision is made, we proceed with the calculations. But this is not so straightforward for the question of boosters, which we can compare in a number of ways. We chose two VE calculations related to the 3-dose booster study:
- Unvaccinated is defined as an individual having no vaccination at all – that is, 3 doses versus no doses.
- 3 doses versus 2 doses, since individuals who currently have 2 doses may wish to understand the relative value of the booster dose.
The question of exclusions
The Government of Alberta produces COVID outcome data relevant to vaccination status, including boosters, making this population a convenient test case. There has been some question of how to treat outcome data for persons within 14 days of receiving their latest vaccine dose. Previous studies have shown that full protection from COVID vaccines is not conferred until about two weeks after vaccination.[8][9]Given this, such data can be either treated as if the individual did not receive that dose, and thus be included in the evaluation, or the data could be excluded. The WHO recommends exclusion.[10]All of our results exclude results occurring within the first 14 days of vaccination.
(We did an evaluation of the effects of excluding or not excluding, and found the effect to be minor for this data.)
VE against ICU-severity outcomes
The estimates for VE are shown in a series of chart below.
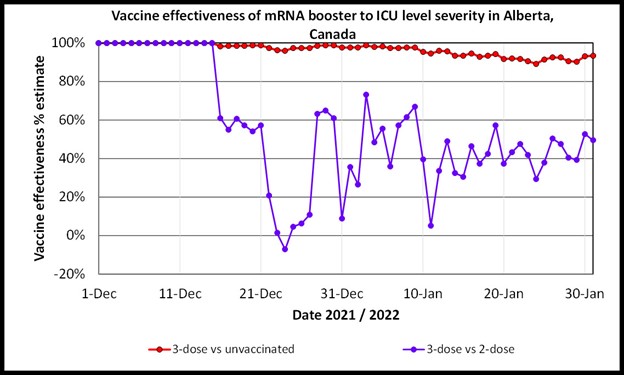
The first chart is for VE estimates for the booster for ICU-level severity with data from Dec. 1, 2021, to Jan. 31, 2022.[11]This chart considers “unvaccinated” to be defined as someone receiving no vaccinations, in red. We also compare the VE of 3 doses versus 2 doses, in blue.
The VE estimates with respect to boosters and unvaccinated persons (red) show a mild decline with time, but all values are above 90%. The near 90% level VE is above the 2-dose ICU-severity VE we noted in Ontario in this article – The best missed prediction: disease severity 50% lower than we predicted.
The blue curve compares the booster to double-vaccinated persons. This comparison was necessary as it represents the choices currently facing people in North America. How effective is the booster compared to double vaccination? The answer is: incrementally helpful. Although most of the VE results are positive, they are volatile. At first, the relative VE was 100%, as very few persons had a booster, but as the booster doses were taken up in greater numbers, the VE became unstable but positive and appears to be tracking and stabilizing at just above 40% at this time.

VE estimates for the booster for ICU level severity with data from Dec. 1, 2021, to Jan. 31, 2022. [12]The VE is above 90% when considering 3-dose versus unvaccinated persons, but is volatile but settling just above 40% at this time when the effectiveness of 3-doses is calculated with reference to double-vaccinated persons.
VE against non-ICU hospitalization outcomes
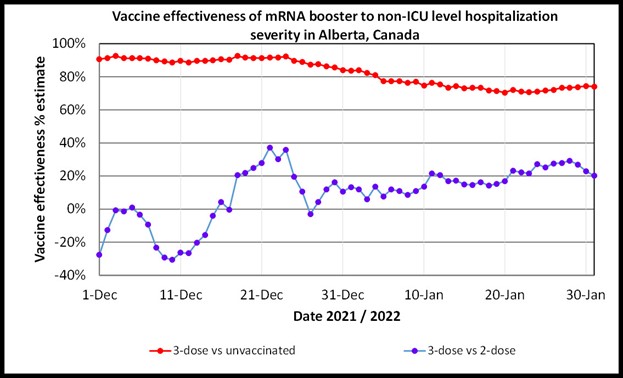
The chart below is much like the first chart in this article, except it considers the VE against non-ICU hospitalization.
The VE values in red consider 3 doses and unvaccinated persons. All of the results in this evaluation are lower than the same comparison for ICU-level severity. The near 70% level VE is above the 2-dose non-ICU hospitalization VE we noted in Ontario in this article – The best missed prediction: disease severity 50% lower than we predicted.
The blue curve compares 3 doses to double-vaccinated persons for non-ICU hospitalization, in the same manner as its companion above for ICI-severity. As above, this calculation addresses the effect of booster doses on fully vaccinated persons. By definition, only fully vaccinated persons can be ‘boosted’, so this comparison – as strange as it may seem – is crucial. The VE values are much lower, though they quickly become positive.
These low results warrant further discussion. However, the indication is that the booster appears to convey small, or incremental, additional protection over the 2-dose group.

VE estimates for the booster for non-ICU hospitalization level severity with data from Dec. 1, 2021, to Jan. 31, 2022.[13]The VE is above about 70% when considering 3 doses versus unvaccinated persons, but is lower when the effectiveness of 3-doses is calculated with reference to double-vaccinated persons.
Unresolved questions and hypotheses to be evaluated
The VE of the booster to double-vaccinated persons is the most relevant result from this analysis, because this is the only logical question to be asked regarding boosters. Does a booster help fully vaccinated persons?
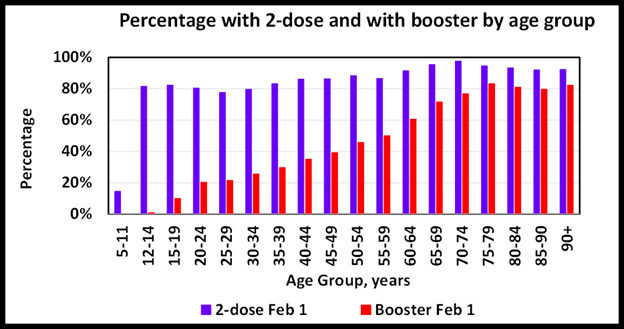
The answer appears to be yes, although in this data the VE suggests only moderate value. However, there could be a reason for these apparent results. As in the chart below, the uptake of booster doses is skewed to the elderly, whereas the 2-dose population is much more even across age groups.[14]Because the elderly dominate the number of COVID patients with severe outcomes, this demographic fact could be creating a false apparent low VE for boosters.[15]The validity of this finding should be tested as the boosters are taken up by younger elements of the population.

Booster and 2-dose demographics Feb. 1, 2022.[16]
Interpretation
Persons with booster doses of mRNA vaccines have a VE of over 90% against ICU-level severity in the Alberta data, when considering the booster versus completely unvaccinated individuals. A VE for boosters against non-ICU-level hospitalization is just above 70% when considering the booster versus completely unvaccinated persons. An interesting result is that booster shows minor to moderate VE values when compared against double-vaccinated persons.
Does this suggest that the booster is unnecessary? Not necessarily, but its effect over 2-dose vaccination appears to be moderate in this data. But perhaps this should have been expected. Most of the value has already been gained with 2 doses, and the booster provides incremental value.
As noted, even with the removal of children under 12 from this analysis, the demographic skew of booster uptake by the elderly could be affecting the VE estimates for the booster at this time.
References
[1] Worldometer, February 2, 2022, United States and Canada
[2] COVID-19 vaccine boosters administered, Our World in Data, February 2, 2022
[3] CDC, COVID-19 Booster Shots, January 19, 2022
[4] Erman, Michael, December 20, 2021, Moderna says booster dose of its COVID-19 vaccine appears protective versus Omicron, Reuters
[5] Cohen, Adam et al, 2012, An Assessment of the Screening Method to Evaluate Vaccine Effectiveness: The Case of 7-Valent Pneumococcal Conjugate Vaccine in the United States, PLOS ONE
[6] Cohen, Adam et al, 2012, An Assessment of the Screening Method to Evaluate Vaccine Effectiveness: The Case of 7-Valent Pneumococcal Conjugate Vaccine in the United States, PLOS ONE
[7] Cohen, Adam et al, 2012, An Assessment of the Screening Method to Evaluate Vaccine Effectiveness: The Case of 7-Valent Pneumococcal Conjugate Vaccine in the United States, PLOS ONE
[8] McKenny, Simon, February 11, 2021, Infectious disease doctor: Vaccines varen’t fully effective until two weeks after the second dose
[9] Tabak, Ying, et al, 2021, Incidence and Estimated Vaccine Effectiveness Against Symptomatic SARS-CoV-2 Infection Among Persons Tested in US Retail Locations, May 1 to August 7, 2021, JAMA Research Letter
[10] WHO, March 17, 2021, Evaluation of COVID-19 vaccine effectiveness: INTERIM GUIDANCE
[11] Interactive aggregate data on COVID-10 cases in Alberta, Government of Alberta, February 2, 2022
[12] Interactive aggregate data on COVID-10 cases in Alberta, Government of Alberta, February 2, 2022
[13] Interactive aggregate data on COVID-10 cases in Alberta, Government of Alberta, February 2, 2022
[14] Interactive aggregate data on COVID-10 cases in Alberta, Government of Alberta, February 2, 2022
[15] Interactive aggregate data on COVID-10 cases in Alberta, Government of Alberta, February 2, 2022
[16] Interactive aggregate data on COVID-10 cases in Alberta, Government of Alberta, February 2, 2022
(Lee Hunt – BIG Media Ltd., 2022)


