Updated data from Ontario as of Jan. 15 shows vaccine effectiveness against hospitalization has dropped to just below 40%, and has stayed at about that level for two weeks. The vaccine effectiveness against new cases remains below zero, but has climbed in the last few days. The vaccine effectiveness against ICU admission dropped moderately and is holding in the mid to upper 70s.[1][2]
We have been following the COVID data in Ontario, Canada, as a proxy for North America, with particular interest in the severity of the Omicron variant. In the Jan. 6 article Omicron update: vaccine effectiveness against ICU admission holds at 80%, we offered a very simple prediction for hospitalization and ICU, with an expected peak on Jan. 16. The projections were wrong, but the exercise has been instructive regarding the severity of Omicron.
This update, using data released Jan. 15, shows three key things:
- Our predictions of hospitalizations and ICU stays were pessimistic by a wide margin.
- This missed prediction plus dropping ratios of severe outcomes to cases is evidence that Omicron is significantly less severe than previous strains, and even less severe than we predicted.
- Vaccine effectiveness (VE) against ICU severity has dropped to a percentage in the high 70s, but has held firmer than VE against hospitalization and, especially, against reported new cases.
Vaccine effectiveness update
We use a consistent procedure to estimate VE, but it is important to note that this is an estimated number, and that certain choices must be made on what population is considered to be vaccinated, and how to handle partially vaccinated persons. Refer to this story for details: Taking a long-term view of the decision to vaccinate. Note that for Ontario, we consider two vaccine shots as fully vaccinated, and one vaccine dose as unvaccinated. This decision could be made another way: by excluding the partially vaccinated from consideration. Such a choice could be made later when considering the effect of the booster. Later in this article, we will use data from another Canadian province – Alberta – to examine the case for the third (booster) dose.
Using data released Jan. 15, we update the VE against cases, hospitalizations, and ICU admissions.[3][4]The VE for ICU admission has dropped a few percentage points, but is holding in the mid-to high 70s, while the VE to hospitalization has held for the last two weeks near 40%.
Regarding the question of whether to vaccinate or not, the VE to severe outcomes is a useful measure of payoff for vaccination. Looking at a normalized number of people who are severely ill is not enough and can be deceiving, because that alone does not speak to the relative value of vaccination. Unlike a simple measure such as normalized incidence, VE accounts for how much of the population is vaccinated, and the relative outcomes for vaccinated and unvaccinated people. VE is the measure of the relative protection of vaccination, as described in Understanding vaccine effectiveness and breakthrough, and we argue is a strong measure of value.
Comparison with Alberta data
Alberta is reporting cases and hospitalizations for two dose and three-dose (includes “booster”) vaccinations. We looked at a snapshot of data taken on Jan. 13 (the last reporting day) to see what the VE looked like for booster data.
Analyzing for booster VE requires a choice to be made. We choose either: (a) that people with the booster are lumped in with those with two doses and treated as fully vaccinated, or (b) that only the people with the booster are treated as fully vaccinated.
Other choices could be made, but this is a starting point.
The table below shows the results of this approach, which appear mixed. More analysis will be required over a greater time range to better understand the effect of the boosters.
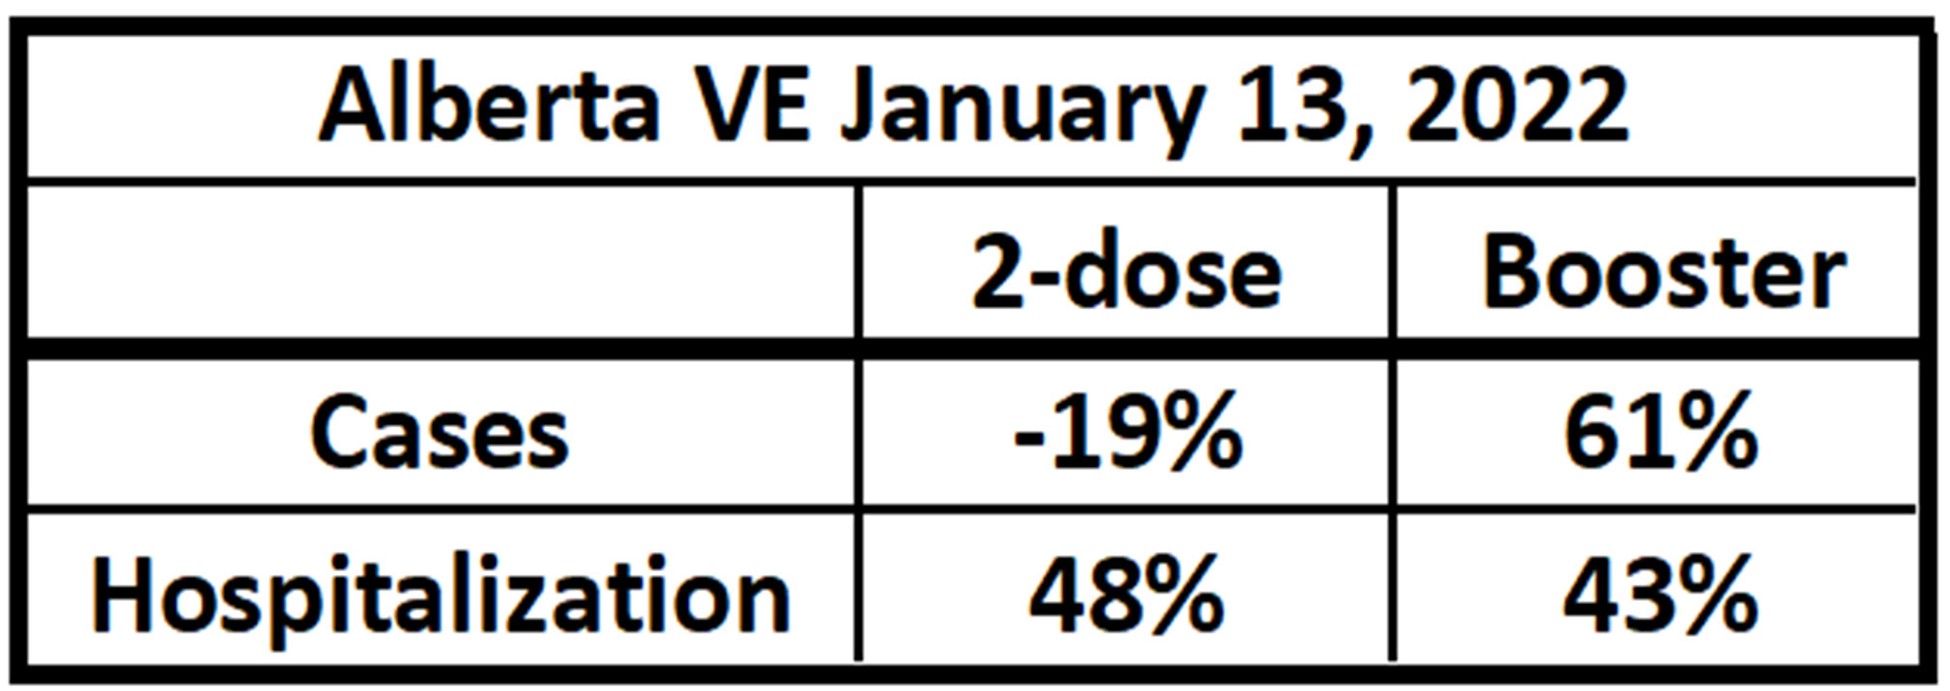
Alberta’s one-day estimate of VE considering booster vaccination, using Jan. 13 data.[5]
These VE numbers to severe outcomes may continue to change somewhat, but enough time has passed with Omicron to suggest the following:
- The VE to catching Omicron is close to zero. That is, the two-dose vaccine appears to confer no relative protection against being detected as a case.
- The VE against hospitalization is moderate, meaning that the vaccines appear to help protect from this level of severity.
- The VE against ICU level severity remains relatively strong, though it has fallen to a mid-70s percentage. This means that vaccination still offers significant protection against ICU-level severity to the vaccine.
Ratio of severe outcomes to cases
We have updated our ratios of severe cases to new cases as first discussed in the article As Omicron cases surge, impact on health care systems is difficult to predict. We use a time lag of two weeks from new cases to severe outcomes to account for the trailing nature of severity.
The ratios are defined as:
- “Hospitalization unvaccinated ratio” is the ratio of the number of persons admitted to the hospital who are unvaccinated by the number of new cases that were unvaccinated, at a time lag.
- “Hospitalization vaccinated ratio” is the ratio of the number of persons admitted to the hospital who are vaccinated by the number of new cases that were vaccinated, at a time lag.
- “ICU unvaccinated ratio” is the ratio of the number of persons admitted to the ICU who are unvaccinated by the number of new cases that were unvaccinated, at a time lag.
- “ICU vaccinated ratio” is the ratio of the number of persons admitted to the ICU who are vaccinated by the number of new cases that were vaccinated, at a time lag.
As of our previous report on Jan. 6 – Omicron update: vaccine effectiveness against ICU admission holds at 80% – the ICU vaccinated ratio was 2.5%. As of yesterday, this ratio has dropped to 1.3%, or nearly in half. This is good news, suggesting that Omicron’s severity is lower each time we assess it.
Our estimation error could be the result of several factors, including:
- Lagging the severe outcomes is imperfect
- As the relative percentage of Omicron in the population increases, the ratio drops
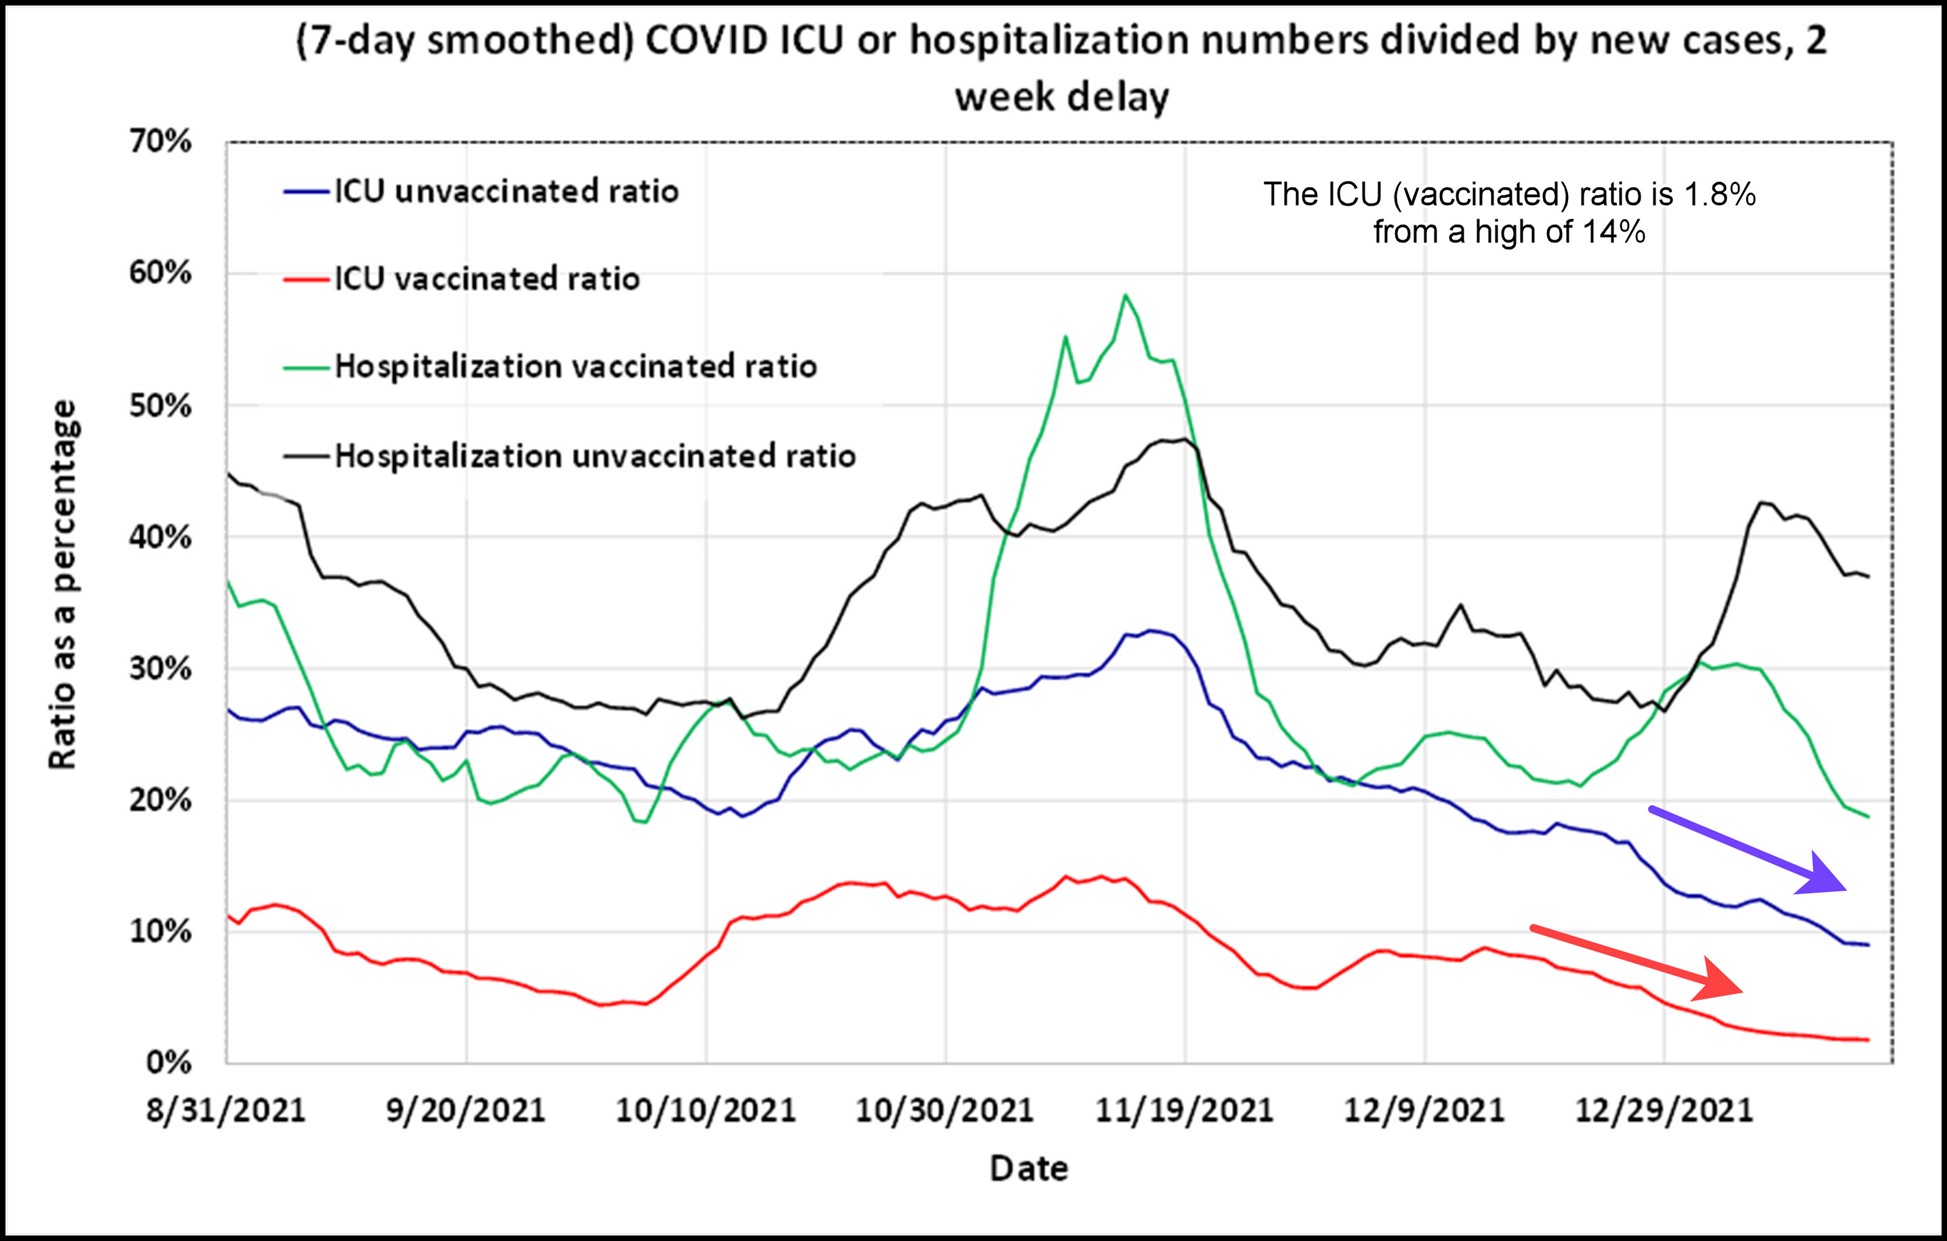
Ratio of the number of new cases being presented to admission to either the hospital or ICU. These ratios are consistent with vaccination status, and have a two-week delay between cases and either hospitalization or admission to the ICU. The ICU ratios continue to drop.[6][7]
What our failed prediction of hospitalization and ICU load teaches us
In the last discussion of these ratios – Omicron update: vaccine effectiveness against ICU admission holds at 80% – we reversed the time lag to make a prediction as far as two weeks in the future using the latest ratio data as of Jan. 5. The predictions for severe outcomes are charted below as well as the actual severe outcomes up to Jan. 15.
The prediction formula we created was ad-hoc, and was defined as:
ICU (t+l) = Case (t) * Ratio where t is a particular date, and l is the time lag in days
The actual hospitalizations and ICU admissions were about half of what we predicted, which is a result of the severity ratios dropping.
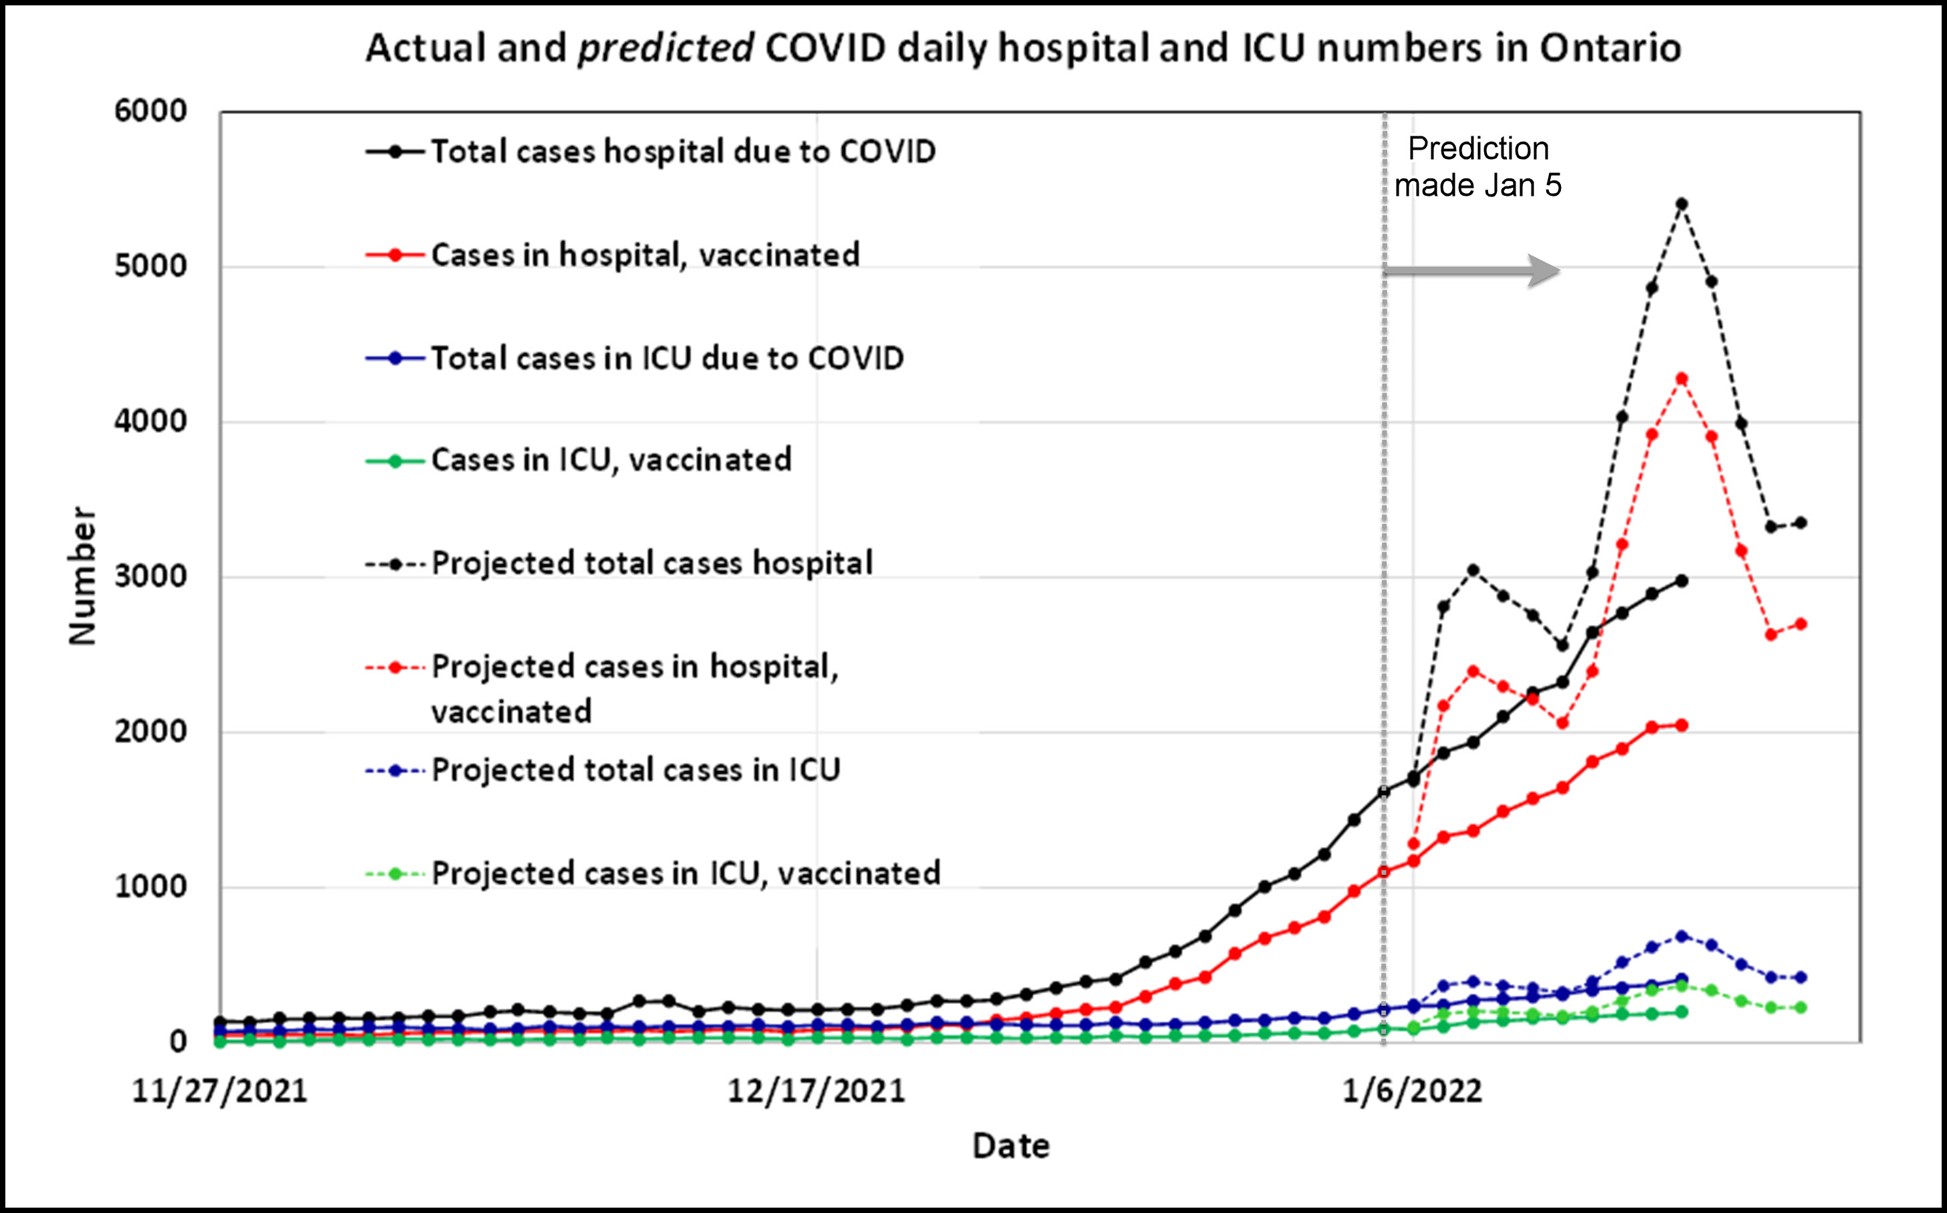
Hospitalization and ICU numbers in Ontario as of Jan. 15, and the predictions of same that were made on Jan. 5.[8][9]The predictions were pessimistic.
So, we were wrong. Omicron’s apparent severity for ICU level severity continues to drop. Being shown to be wrong presents an opportunity to learn, and reinforces the importance of testing and measuring. We learn best when we predict, and then analyse why we are wrong. For when we predict, we are generally at least somewhat in error. 20th-century statistician George Box captured the concept well when he said, “All models are wrong, but some are useful.”
How much less severe is Omicron?
Estimating the difference in severity is an exercise in comparing things relatively. Comparing a severity indicator now to the same indicator in the past cannot provide definitive answers. It is best discussed in a variety of ways.
While this could be the focus of a future article, let’s take one simple estimate now: we will use the ICU vaccinated case ratio as our measure. And we will take the average ratio in October 2021 (11%) and the latest ratio as of Jan. 15, 2022 (1.3%).
These numbers suggest that Omicron is only 12% as severe to ICU risk for vaccinated persons as the dominant variant was as of October 2021. Based on our chart of ratios, this is almost certainly the most optimistic measure of Omicron’s relative severity. However, since most of the population is vaccinated, it is relevant.
Interpretation
If you wish to be wrong, make a prediction. However, incorporating a scientifically sound approach, we present hypotheses based on an understanding of a phenomenon. From that understanding comes certain predictions. Then we test the hypothesis by observing the presence or absence of the predicted outcome. This is how we learn. We showed that our simple prediction for ICU and hospitalization in Ontario was wrong. There are many ways in which our model could have failed. The most likely one is that Omicron is less severe than even our optimistic predictions. We estimate that the relative severity (ICU level) of the Omicron variant could be as low as 12% compared to that of the strain in October for vaccinated persons.
Hospitalizations and ICU beds from COVID are still historically high in Ontario, which is causing strain on the healthcare system there. However, the low relative severity of Omicron is good news.
Current estimates of the vaccine effectiveness against hospitalization is holding steady at just below 40%, and the effectiveness against ICU dropped and is holding around 75%. Further investigation will be conducted as data from rapidly spreading Omicron brings further insights.
[1] COVID-19 Vaccine Data in Ontario, Ontario Government, January 5, 2022
[2] Hospitalizations, Ontario Government, January 5, 2022
[3] COVID-19 Vaccine Data in Ontario, Ontario Government, January 5, 2022
[4] Hospitalizations, Ontario Government, January 5, 2022
[5] Interactive aggregate data on COVID-19 cases in Alberta, Government of Alberta, January 16, 2022
[6] COVID-19 Vaccine Data in Ontario, Ontario Government, January 5, 2022
[7] Hospitalizations, Ontario Government, January 5, 2022
[8] COVID-19 Vaccine Data in Ontario, Ontario Government, January 5, 2022
[9] Hospitalizations, Ontario Government, January 5, 2022
(Lee Hunt – BIG Media Ltd., 2022)