As part of my research for this article Mounting COVID frustration is no reason to abandon fundamental principles, BIG Media, I read an article in a news post about a Texas doctor, her data on infectivity between the vaccinated and unvaccinated, and the doctor’s conclusions about vaccine effectiveness.[1] I noted to myself that the doctor’s conclusions appeared suspicious and that the news report failed to either note the anomalous report or support its incongruity. This led to three thoughts:
- That it is okay – and sometimes important – to be productively skeptical, even of the experts. This is a nuanced issue around appealing to authority. It makes sense to show respect to doctors’ and researchers’ expertise and be open to learning from new ideas. But sometimes even those we would expect to understand issues in depth make mistakes. If we have the expertise to check, and a suspicion that something is not right, we should consider doing the math.
- That we should examine the claim made by the doctor in the article and see if it is indeed incorrect, or if there is something new to be learned in the examination.
- Perhaps a chart would help readers evaluate vaccine effectiveness better. As we promote the idea of “doing the math”, we should make the data presentation reader friendly.
The double-edged sword of appealing to authority
We read the conclusions of experts every day. When we do, we are faced with the choice of believing them, not believing them, or of checking their work. Because the experts are assumed to have knowledge on the subject matter that far exceeds our own, accepting their conclusions is natural. That is why it is not uncommon in logic and critical thinking to make a valid appeal to authority. In this article BREAKING NEWS … into rational pieces, we explored another facet of the appeal to authority: that under some circumstances, such an appeal may constitute a logical fallacy. Such errors occur when experts step outside their authority, or violate the rules of logic. Unfortunately, evaluating the veracity of a subject matter expert’s claim is difficult for anyone – including time-crunched readers – which is why it is important that journalists act with diligence in their use of expert opinions.
The double-edged sword of taking an expert’s opinion either too readily or without enough analysis should be wielded carefully. Our skepticism is best used productively and out of a sense of curiosity and objective discovery. The unexpected and possibly uncomfortable claim could, after all, be correct.
Primer on vaccine effectiveness
In this article Understanding vaccine effectiveness and breakthrough, we explained the estimation of vaccine effectiveness (VE) through the screening method. The screening method is an observational process that uses publicly available data. Its accuracy is directly dependent on the quality of that recorded data. The screening method requires the following information from a particular region during a particular time period:
- The proportion of vaccinated amongst total COVID infections – PCV
- The proportion of unvaccinated amongst total COVID infections – PCU (100%-PCV)
- The proportion of the population vaccinated – PPV
The formula for the VE estimate from this method is:
Vaccine efficiencies that are less than 100% mean that the vaccine is not providing perfect, total protection. However, the higher the vaccine efficiency number is the more relative protection it is providing.
Updated data example of vaccine effectiveness
It should be noted that vaccine effectiveness may mean different things, depending on context. It could refer to transmission or symptomatic disease – which are not the same thing – it could mean effectiveness against non-ICU hospitalization, against ICU hospitalization, or even death. Generally, vaccine effectiveness has been seen to be lower against less severe outcomes such as symptomatic disease and transmission, and higher against more severe outcomes.
In this recent piece Taking a long-term view of the decision to vaccinate, we examined the vaccine effectiveness in the Canadian provinces of Alberta and Ontario, where the data is generally considered trustworthy and is easy to obtain.
An updated chart is shown below for Ontario.[2] It shows that vaccine effectiveness continues to be high against symptomatic disease (cases), hospitalization, and ICU-hospitalization. Vaccine effectiveness against ICU-level hospitalization is still greater than 90%. Interestingly, the vaccine effectiveness shows a recent declining trend for cases and hospitalizations, which are now below 80%.
These declining vaccination effectiveness trends are consistent with CDC reports of similar trends in the United States.[3] Based on these vaccine effectiveness estimates, the COVID vaccines appear to be reasonably effective, though as expected, they do not provide absolute protection and should not be claimed to be doing such.
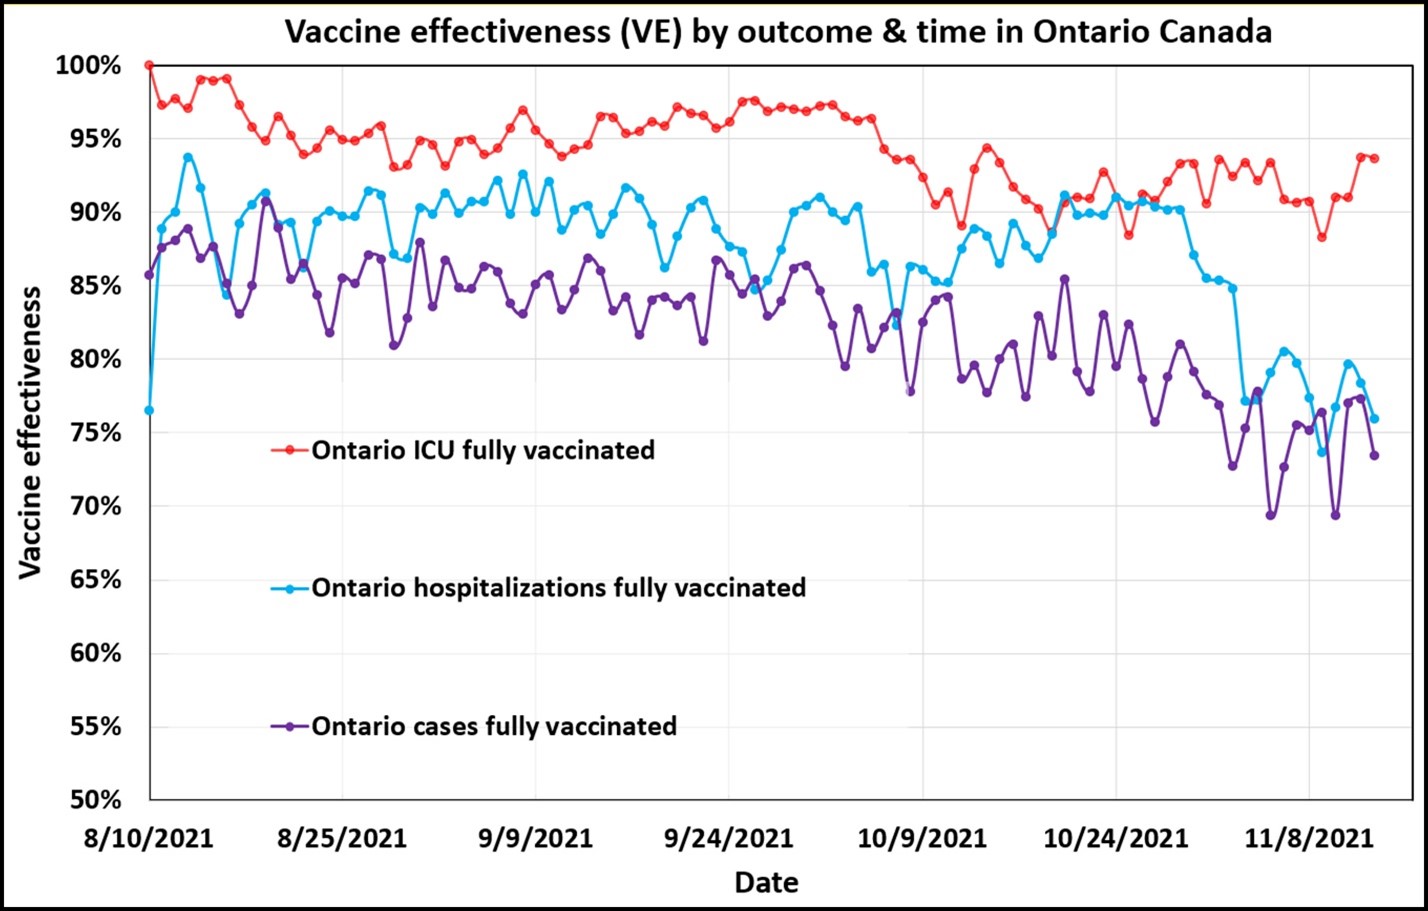
Updated vaccine effectiveness estimates for Ontario. Data from the Government of Ontario, Nov. 13, 2021.[4]Vaccine effectiveness is still fairly high, especially for ICU hospitalization, but shows a declining trend, especially in less severe outcomes. This warrants continued monitoring.
Claim by Texas physician
A Houston doctor made the claim, “The data I have collected suggests that the vaccine is not working. 42% of the patients that we treated with IV monoclonal antibodies for symptomatic COVID were fully vaccinated.”
In other words 42% of this doctor’s patients were fully vaccinated, therefore, she says, the vaccine is not working. This was reported on Nov. 8.
Let us estimate the vaccine effectiveness from this data.
PCV = 42%, therefore PCU = 58%
The news report did not include the percentage of the doctor’s patients who were vaccinated, which is vital to evaluating the claim that “the vaccine is not working”, so an assumption must be made. The PPV in Houston (Harris County) is estimated at 56.9% fully vaccinated, for all ages. This number is updated as of Nov 11, 2021. It would have been slightly lower at the time of the doctor’s report, but likely not more than a percentage point.[5]
Assuming the same percentage applies to the patients going to this doctor’s office, the VE estimate for this doctor’s patients is therefore 45%.
Evaluation of the claim: sample size issue
What does this mean? Remember that the definition of vaccine effectiveness is, “The percentage reduction in the incidence of disease among vaccinated persons compared with unvaccinated persons,” and it is a relative measure.[6]At 45%, the doctor’s patients were benefiting from vaccination, although they were not benefiting as much as one might expect.
Pulling data from Texas proved challenging, but apparent vaccine effectiveness against cases seemed to be between 86% and 90% between Sept. 4 and Oct. 1.[7] [8] Even if the results from the Sept. 4 to Oct. 1 period dropped in Texas, as they did in Ontario, effectiveness numbers in the 75% range could have been expected, not 45%.
But let us put this in perspective. The difference in effectiveness is material, but not as unlikely as I thought when first reading the article. The doctor’s claim of a lower vaccine effectiveness could be a result of a smaller sample size, after all she is only reporting the results from her practice. This could be a statistical anomaly, and not necessarily an unusual one. Sample size is vitally important in studies of the natural world, especially as the sample size becomes small. In this case, rather than the millions of people in Texas and Ontario, we might be looking at a few hundred patients.
There are two problems in reporting here: the sample size, or the number of patients the doctor was referring to, and the percentage of that population who were vaccinated, were both not stated. Without that data, the conclusion of the doctor cannot be taken very seriously.
There is no reason to believe that the doctor’s data was incorrect, but the lack of context, and the missing data in the report leave questions. If the vaccine effectiveness really is as low as 45%, further investigation might be warranted, and something might be learned. As it stands, the estimated vaccine effectiveness in the state of Texas as a whole does not appear very different from that of Ontario and does not support a claim that vaccines are not working.
This leads to the principal criticism of this news piece: the argument presented by the expert, that “Vaccines are not working” fails to meet the criterion of adequacy. This tenant is from critical thinking and was reported in this article, BREAKING NEWS … into rational pieces. It states that in order for an argument to be adequate, it must overcome the burden of its strength – or how certain the conclusions are delivered – as well as the importance of its consequence. In this case the doctor’s claim was unequivocal, and the importance of the claim was very high.
A handy chart for readers
We present below a chart showing the vaccine effectiveness and its relationship to the percentage of the sick people who are vaccinated (in gray) and the percentage of the population who are vaccinated (light blue). As the percentage of the population who are vaccinated rises, we should expect that the percentage of the population who are vaccinated and become sick will also rise. BIG Media first reported this expectation in this article Understanding vaccine effectiveness and breakthrough.
Even as high as 40-50% (or higher) of the people who are sick may have been vaccinated with high vaccine effectiveness if a large percentage of the population has been vaccinated.
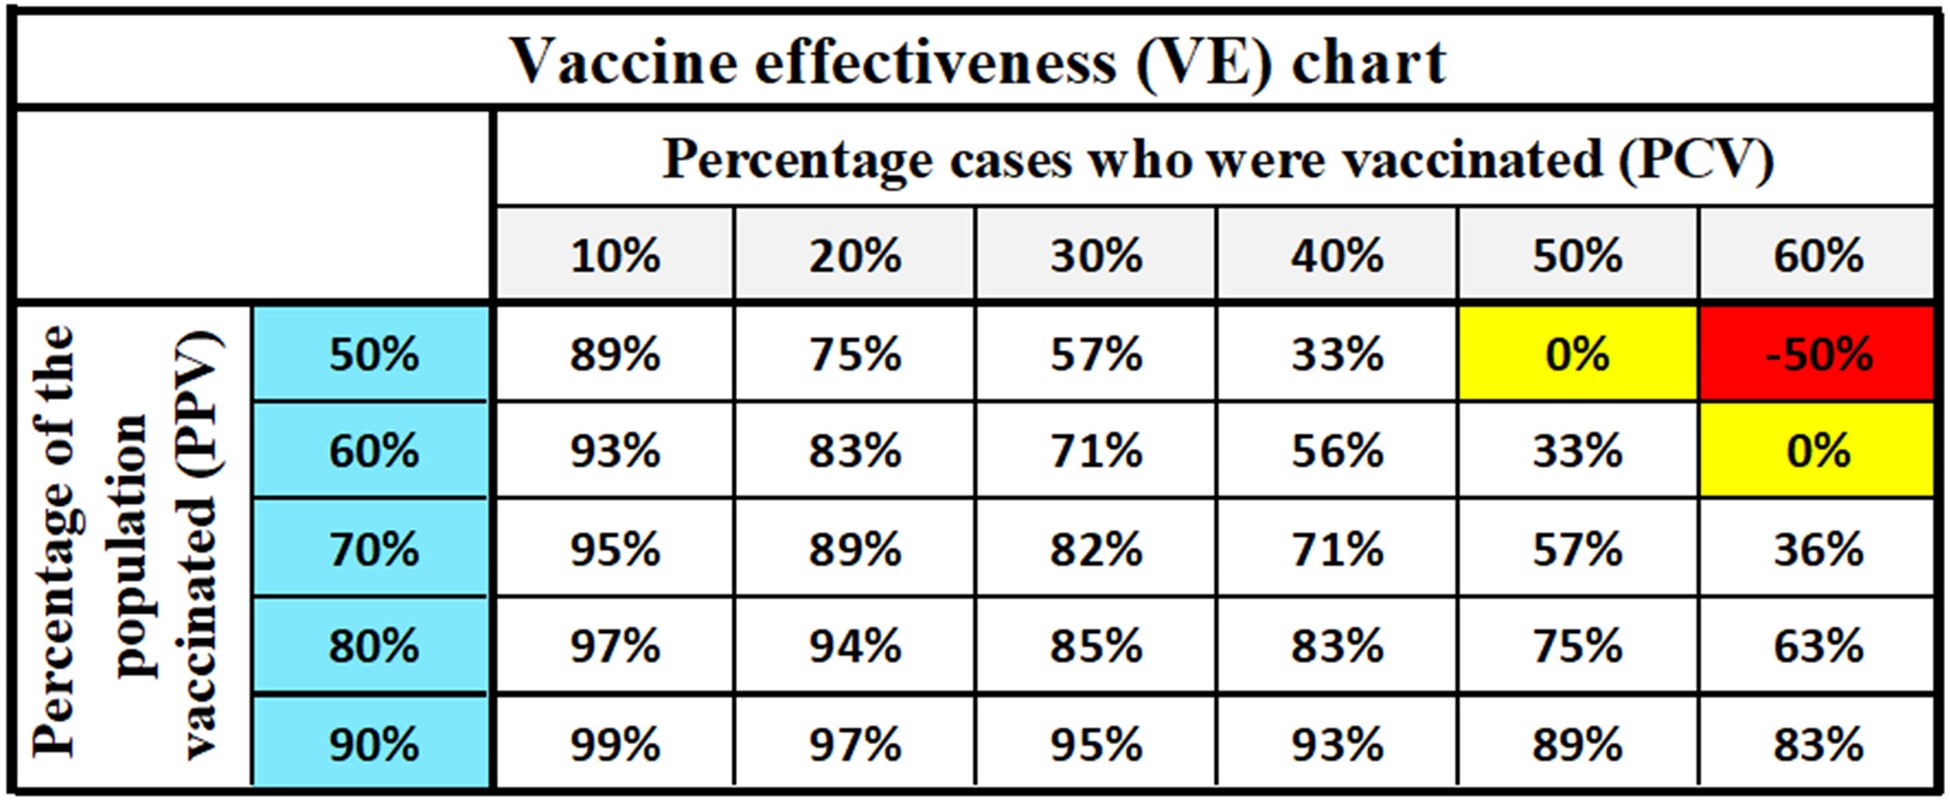
Chart indicating the vaccine effectiveness (VE) given a particular percentage of the people who got sick who were vaccinated (gray) and the percentage of the population who are vaccinated (blue). The meaning of “get sick” can be changed to reflect any severity of the sickness that is required. The yellow cells denote the 0% VE number, at which vaccination had no effect on the likelihood of getting sick from the disease in question. The red shaded cell indicates a negative VE, which means that getting vaccinated increases the likelihood of becoming sick. Chart numbers supplied directly from the VE equation first presented in Understanding vaccine effectiveness and breakthrough and rewritten in this article. The range of numbers used reflect the current range of vaccination in much of North America and Europe.
Interpretation
Was the expert (the doctor) wrong? This is difficult to assess, but her prediction does not look as unlikely or strange as it seemed on first glance. Eventually, we should expect to see a high percentage of vaccinated among the cases. The concerning aspect of the report was not the percentage vaccinated amongst the cases, but the unqualified and consequential conclusion that the expert reached. On the flip side, it is also inappropriate for any expert, given the steadily increasing data available, to claim unequivocally that the current regime of COVID vaccines is completely effective or entirely safe.
And here we can infer three important concepts:
- That an objective look into someone else’s data and conclusions may be an opportunity to learn.
- That expert opinions are the most vulnerable when they exceed the adequacy of their evidence. Any strong conclusion taken from limited data should be viewed skeptically, no matter how great the authority.
- The effectiveness of the approved COVID vaccines remains relatively high, although they appear to be declining. Just as no expert should, without sufficient data, claim they are “not working”, neither can it be stated that they provide ideal protection.
References
[1] Miller, Emily, Nov 8, 2021, Texas Doctor Will Only Treat Unvaccinated, Emily Post News
[2] Ontario Government, November 14, 2021, COVID-19 vaccinations data
[3] CDC, COVID Data Tracker
[4] Ontario Government, November 14, 2021, COVID-19 vaccinations data
[5] NPR, November 11, 2021, How is the COVID-19 vaccination campaign going in your state?
[6] Cohen, Adam et al, 2012, An Assessment of the Screening Method to Evaluate Vaccine Effectiveness: The Case of 7-Valent Pneumococcal Conjugate Vaccine in the United States, PLOS ONE
[7] Texas Department of State Health Services, November 8, 2021, COVID-19 Cases and Deaths by Vaccination Status
[8] Harris County / City of Houston COVID-19 Data Hub, Nov 14, 2021, Vaccine info
(Lee Hunt – BIG Media Ltd., 2021)