
Updated vaccine effectiveness in Ontario as of Dec. 30 shows effectiveness against hospitalization has suddenly dropped to 43%. The vaccine effectiveness against new cases is below zero. The ICU vaccine effectiveness is holding above 80% for now.[1][2]
As discussed in the recent article As Omicron cases surge, impact on health care systems is difficult to predict, COVID-19 cases have been rising dramatically in the United States and Canada over the past few weeks, largely driven by the highly transmissible Omicron variant. In our previous reporting, we noted that the vaccine effectiveness against new cases had dropped precipitously to below zero, although the vaccine effectiveness against severe outcomes had remained high.
There was an incongruity in having a high effectiveness against severe case but a low effectiveness against new cases. Such a phenomenon begged the question of whether this unexpected break in the correlation of vaccine effectiveness was due to some fundamental change in the virus or if it was merely an effect of the time lag between the surge in cases and the development of more severe outcomes.
That incongruity has begun to resolve itself through new data that shows that the vaccine effectiveness against hospitalization has dropped abruptly. This article updates our previous reporting with the new data.
Ontario, Canada, is again our example dataset, although case loads are rising throughout North America.
Confirmed new cases in the U.S. for Dec. 29, are 475,404, which is sharply upward.[3] Canada saw 32,120 new cases reported for Dec. 29.[4]Ontario has been on the leading edge of the Omicron variant, accounting for over 10,000 cases on Dec. 29.[5]We continue to track the events in Ontario, using that province as an indicator of what to expect in other jurisdictions.
The key question with Omicron is: how severe is it? Because severe outcomes such as hospitalization and ICU admission are trailing indicators, we have not been able to adequately address this question to date. We still lack enough information to be definitive, however, the new information on vaccine effectiveness suggests that the vaccines are no longer providing as strong a relative protection against hospitalization as they were even a week ago. This delayed statistical impact has likely been a result of the time lag between new cases and severity.[6][7]
Updated vaccine effectiveness
The vaccine effectiveness data has been updated as of Dec. 30, and is charted above.[8] [9]Vaccine effectiveness to new cases has remained negative since our last update. The vaccine effectiveness against severe outcomes has become more complex. In our last report, effectiveness against hospitalization and ICU admission had both remained high. The new data shows that although vaccine effectiveness against ICU admission is still over 80%, the effectiveness against hospitalization has dropped to 43%. This drop is congruent with the idea that we are seeing a time-lag effect. All the measures of vaccine effectiveness may eventually show similar trends. We will continue to monitor the data, and provide updates as the data gains integrity, and trends become more meaningful.
Hospitalizations and ICU admissions
The case numbers – both non-severe and severe – should eventually be an indicator of Omicron’s effect on the health care system. The chart below outlines this for new cases and severe outcomes. New cases have risen sharply.[10][11]The effect of the Christmas holiday season has likely not been fully realized yet, but this should become more clear in the near future.
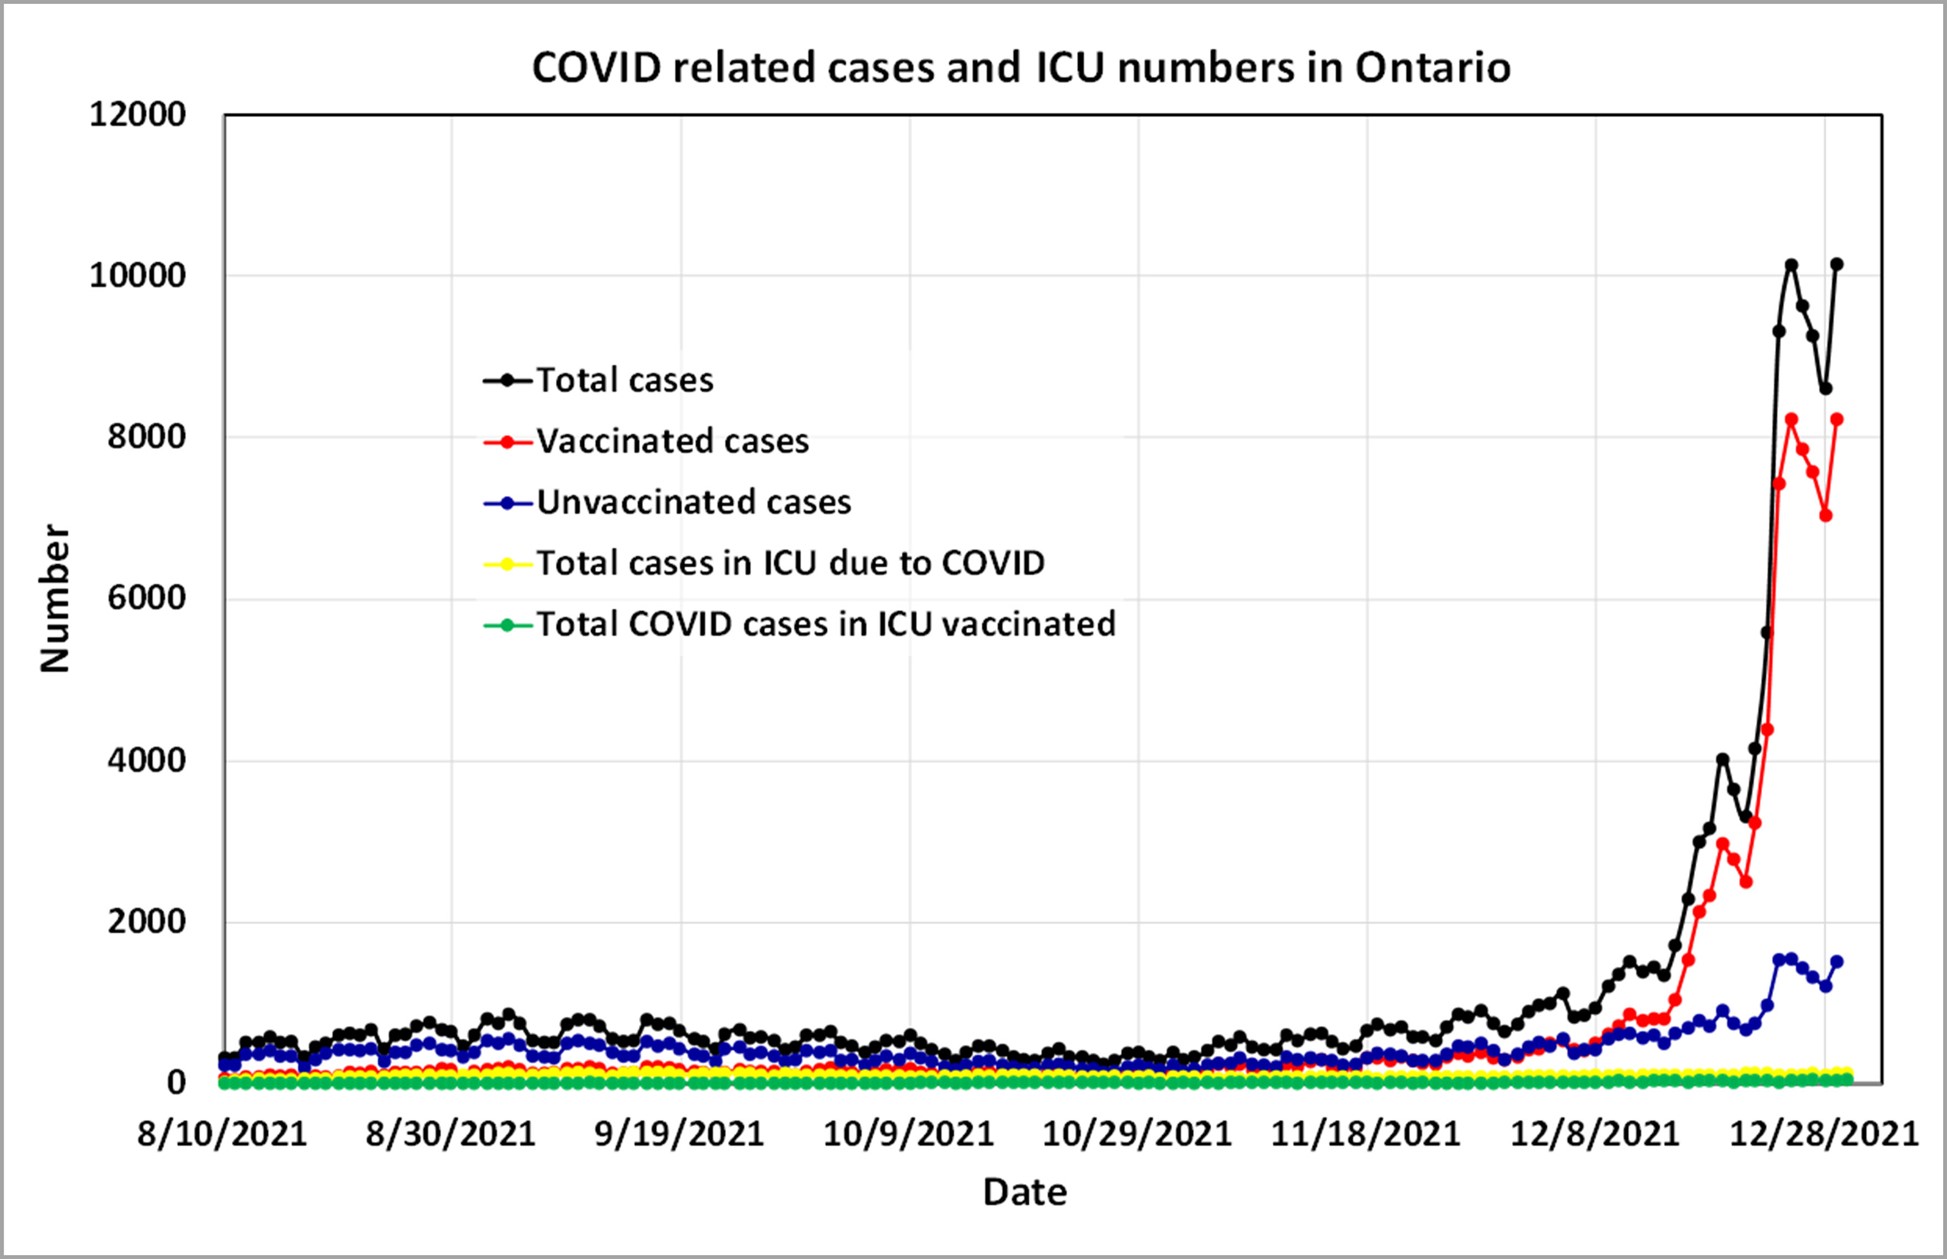
Updated case and ICU numbers in Ontario as of Dec. 30 show that case numbers among the vaccinated abruptly surged. ICU trends are difficult to see as they are relatively lower.[12][13]
Because the new case numbers are so high in comparison to ICU numbers, a separate chart that only includes daily hospital and ICU admissions is presented below.
There has been a slight rise in ICU admissions, though it is moderate in comparison to the new case numbers. Admissions to the hospital are rising much more sharply. Because the vaccine effectiveness against hospitalization has abruptly dropped and vaccination rates are high, it is inevitable that a significant portion of these hospitalizations are vaccinated persons.

Updated ICU numbers in Ontario as of Dec. 30 show that ICU admissions are rising moderately. The daily admissions to the hospital are rising more sharply. This is consistent with the drop in vaccine effectiveness against hospitalizations.[14][15]
Continuing to track Omicron’s severity
The true severity of Omicron has been the subject of understandable speculation. The daily hospitalization and ICU admission numbers are indicative of the current strain on the health care system but do not by themselves indicate the severity of this new variant.
Omicron’s severity could be specifically tracked by utilizing a ratio of severe outcomes to new cases. We continue our analysis of severity through a specific set of ratios that we first introduced in the article As Omicron cases surge, impact on health care systems is difficult to predict. We showed that a time lag of one to two week needs to be applied between the onset of new cases and the severe outcomes. This will account for the delay in severe outcomes.
We still lack sufficient data for these ratios to yield definitive answers, however we have updated them in the charts below. Let us again define the ratios for clarity:
- “Hospitalization unvaccinated ratio” is the ratio of the number of persons admitted to the hospital who are unvaccinated by the number of new cases that were unvaccinated, at a time lag.
- “Hospitalization vaccinated ratio” is the ratio of the number of persons admitted to the hospital who are vaccinated by the number of new cases that were vaccinated, at a time lag.
- “ICU unvaccinated ratio” is the ratio of the number of persons admitted to the ICU who are unvaccinated by the number of new cases that were unvaccinated, at a time lag.
- “ICU vaccinated ratio” is the ratio of the number of persons admitted to the ICU who are vaccinated by the number of new cases that were vaccinated, at a time lag.
The charts both show that for those contracting COVID, the ones who are vaccinated have a lower relative chance of being admitted to the ICU. The same is true for hospitalization, but to a lesser degree in this updated analysis.
For the one-week time lag case, all ratios appear to be dropping, which would indicate a decrease in relative severity of COVID. The trends for the two-week lag are less definitive. If Omicron is truly less severe, we would expect this downward trend to continue.
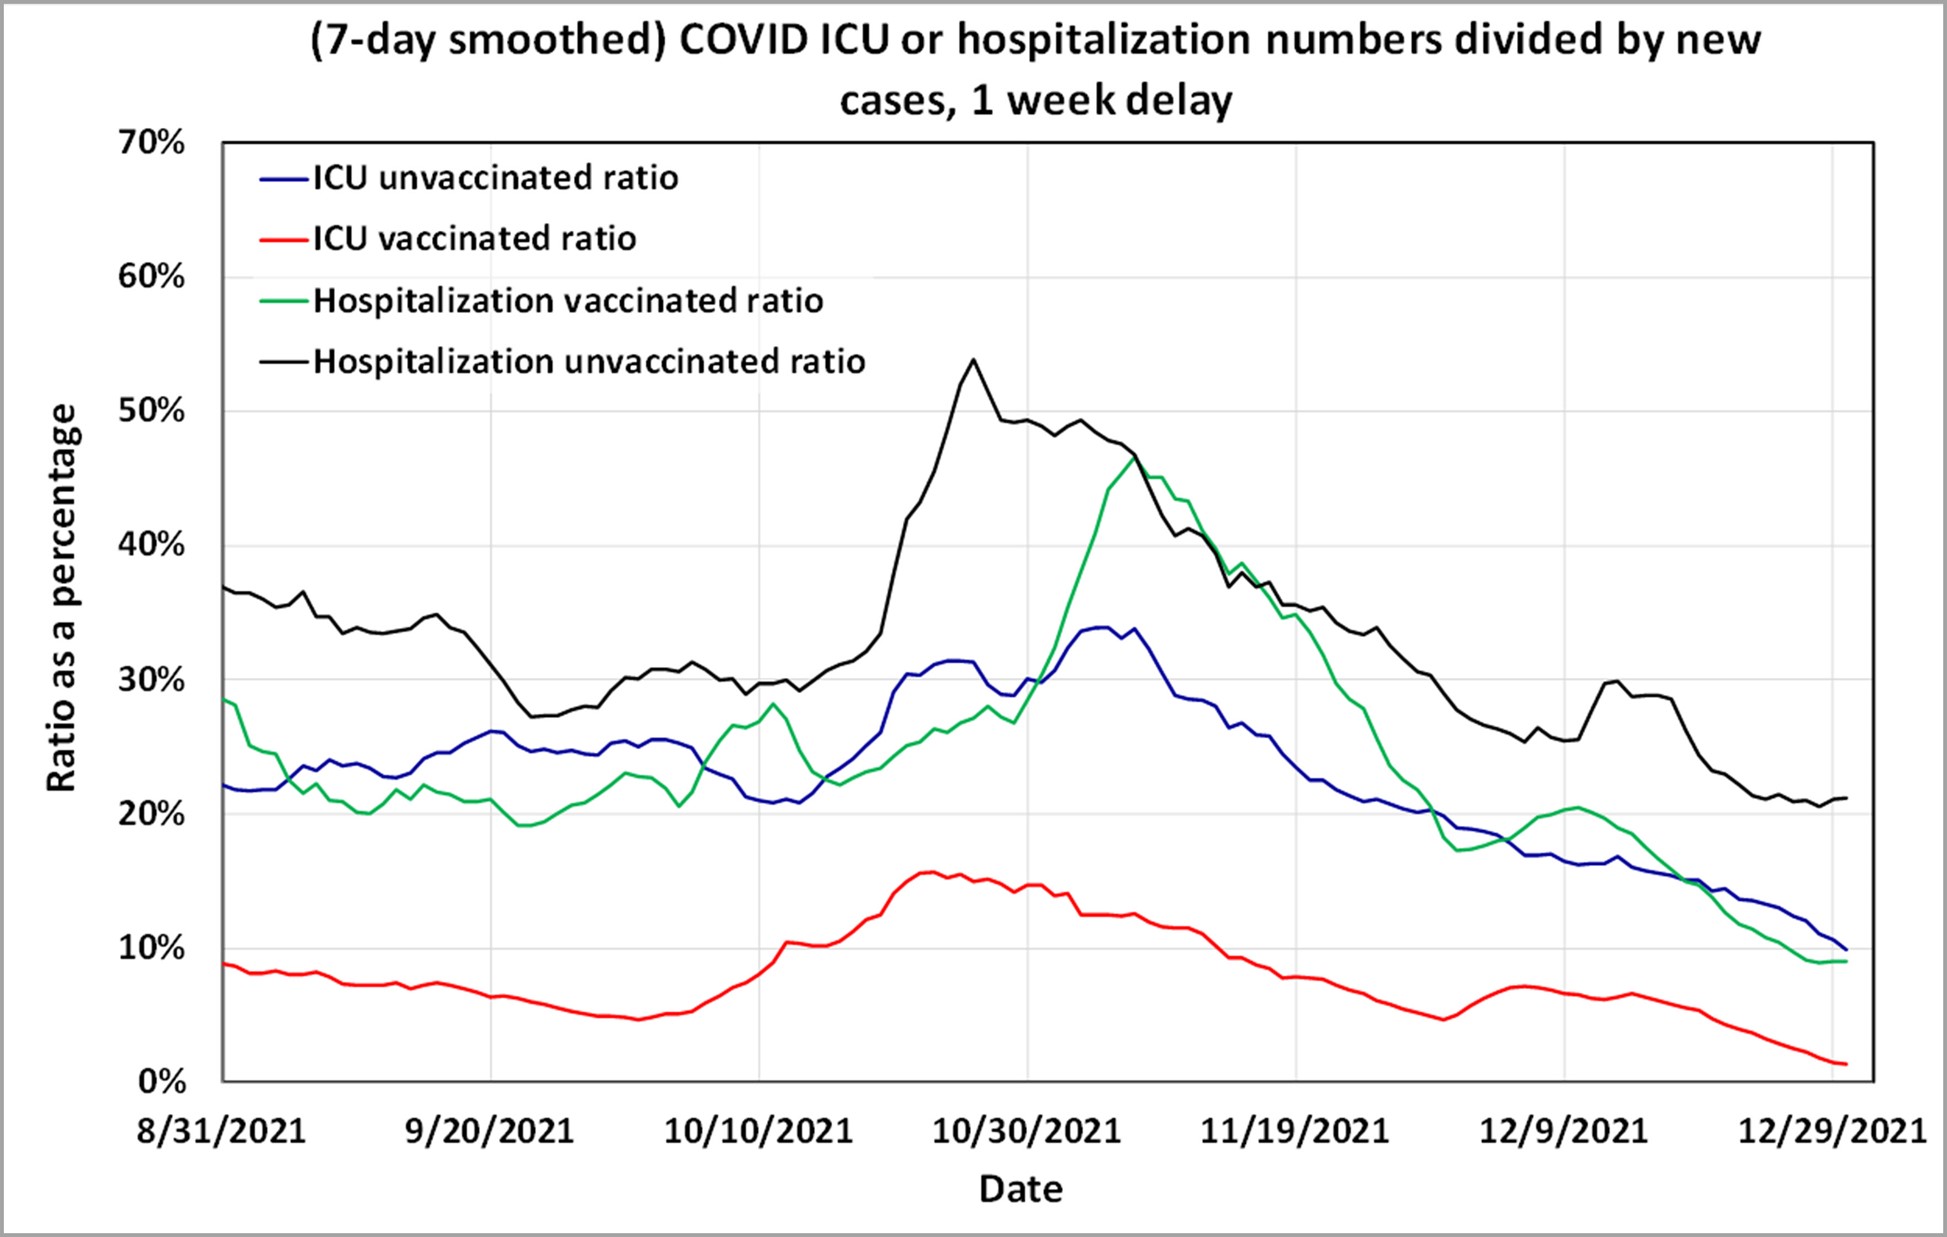
Ratio of the number of new cases being presented to admission to either hospital or ICU. These ratios are consistent with vaccination status, with a one-week delay between cases, and either hospitalization or admission to the ICU.[16][17]
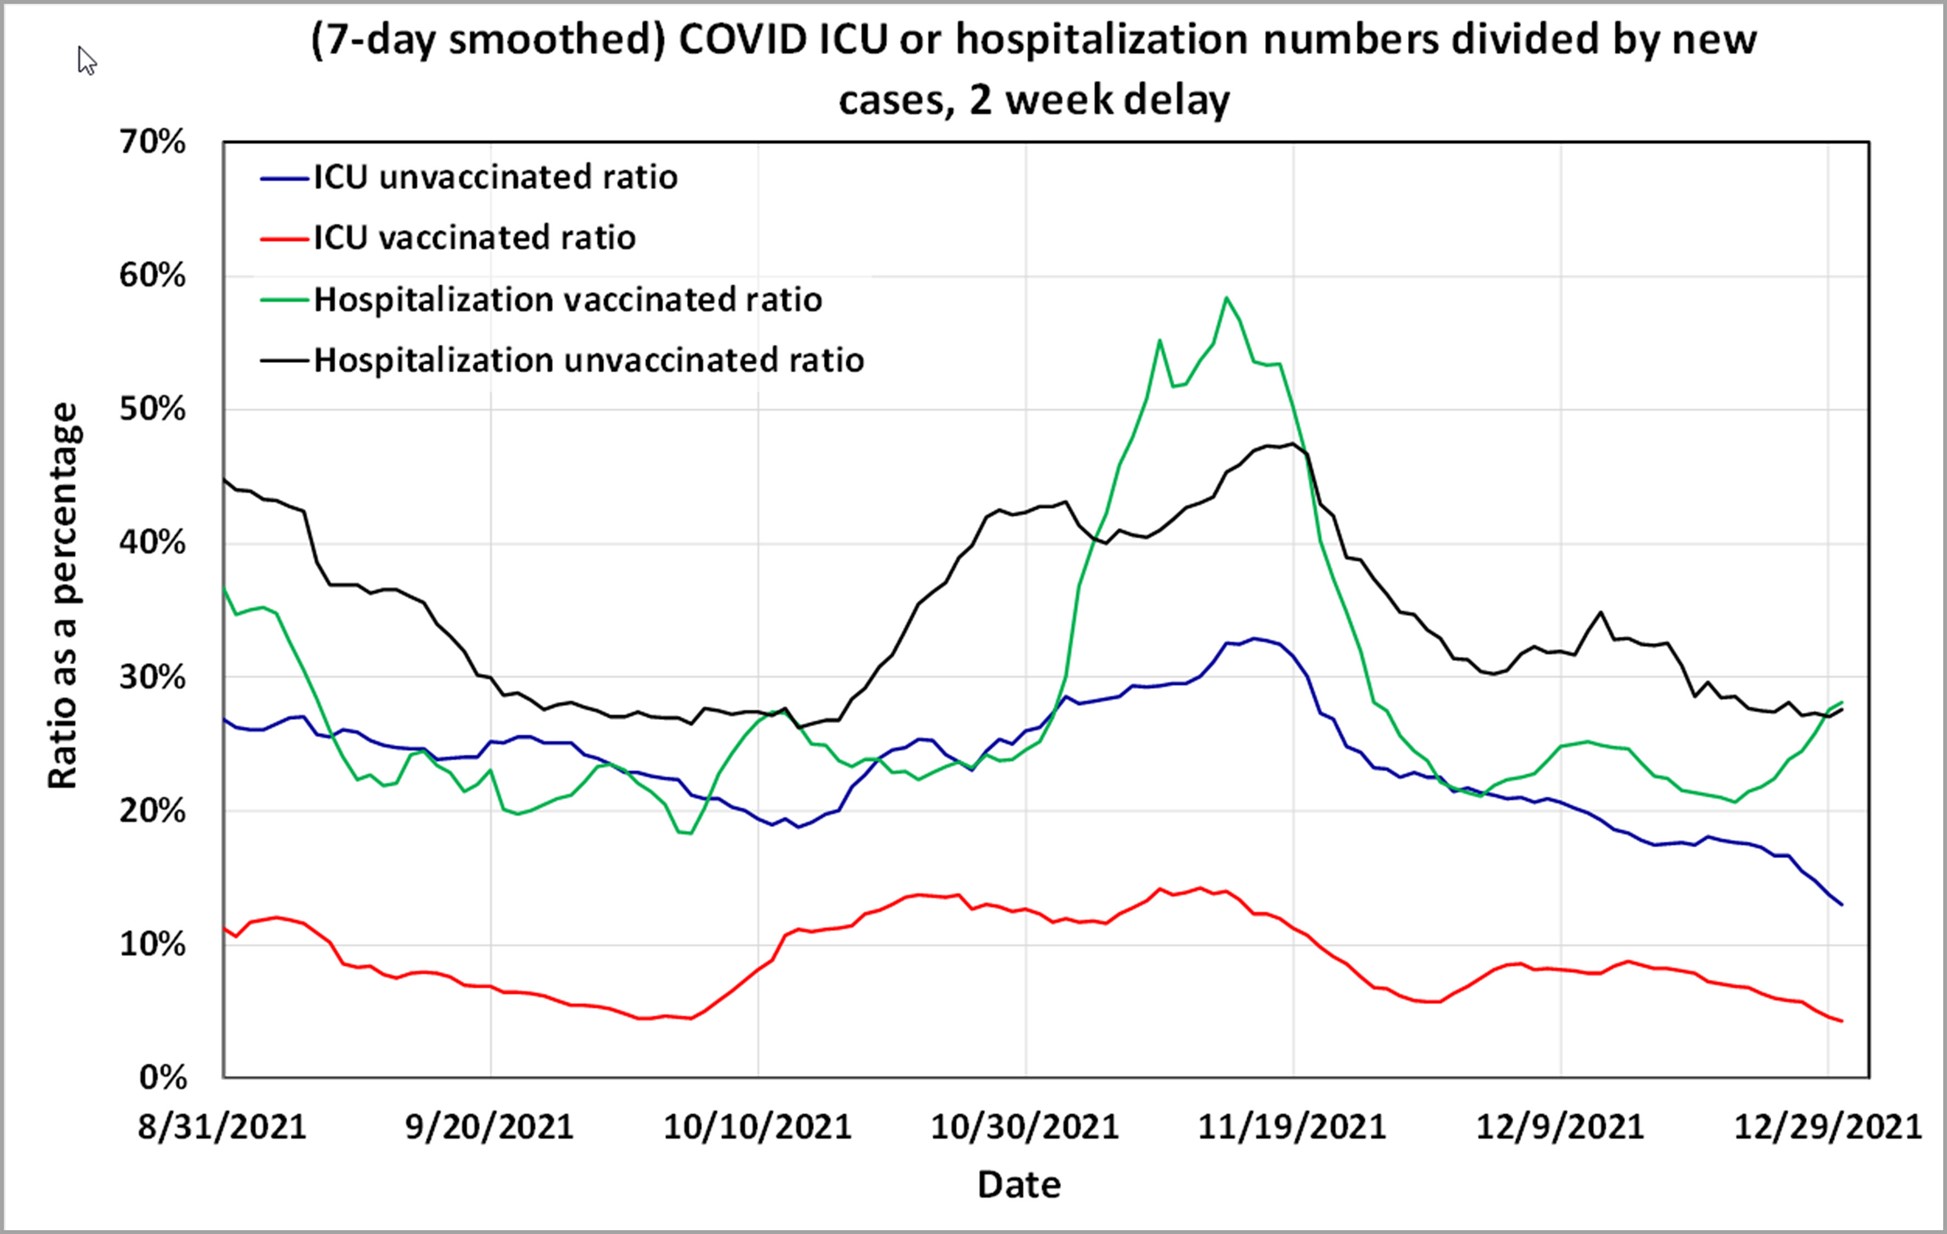
Ratio of the number of new cases being presented to admission to either the hospital or ICU. These ratios are consistent with vaccination status, and have a two-week delay between cases and either hospitalization or admission to the ICU. The ICU ratios are dropping slightly, while the hospitalization ratio is rising for vaccinated, and levelling off for unvaccinated.[18][19]
Interpretation
COVID cases have continued to increase, and although the daily admissions to the ICU have yet to rise sharply, hospitalizations have increased at a greater rate. The ratios of severe outcomes to new cases show some support for the notion that Omicron may be less severe than previous strains such as Delta. However, the trends are uncertain. We will update this analysis with new information as it becomes available.
The vaccine effectiveness against hospitalization has dropped to 43%, which is concerning. While the effectiveness against ICU admissions has yet to drop, the concern that its continuing high numbers are due to an effect of time lag is top of mind.
[1] COVID-19 Vaccine Data in Ontario, Ontario Government, December 30
[2] Hospitalizations, Ontario Government, December 30, 2021
[3] Worldometer, December 30, 2021, United States
[4] Government of Canada, December 29, 2021, COVID-19 daily epidemiology update
[5] Government of Canada, December 29, 2021, COVID-19 daily epidemiology update
[6] Tuite, Ashleigh, et al, March 29, 2021, COVID-19 Hospitalizations, ICU Admissions and Deaths Associated with the New Variants of Concern, Science Table COVID-19 Advisory for Ontario
[7] Sutherland, Esther, et al, June 29, 2021, Coronavirus (COVID-19) Infection Survey technical article: waves and lags of COVID-19 in England, June 2021
[8] COVID-19 Vaccine Data in Ontario, Ontario Government, December 30
[9] Hospitalizations, Ontario Government, December 30, 2021
[10] COVID-19 Vaccine Data in Ontario, Ontario Government, December 30
[11] Hospitalizations, Ontario Government, December 30, 2021
[12] COVID-19 Vaccine Data in Ontario, Ontario Government, December 30
[13] Hospitalizations, Ontario Government, December 30, 2021
[14] COVID-19 Vaccine Data in Ontario, Ontario Government, December 30
[15] Hospitalizations, Ontario Government, December 30, 2021
[16] COVID-19 Vaccine Data in Ontario, Ontario Government, December 30
[17] Hospitalizations, Ontario Government, December 30, 2021
[18] COVID-19 Vaccine Data in Ontario, Ontario Government, December 30
[19] Hospitalizations, Ontario Government, December 30, 2021
(Lee Hunt – BIG Media Ltd., 2021)


Great post Lee! A few thoughts about some of the biases in public data currently (that might effect the hospitalization vaccinated ratio):
– There are 3-4x more vaccinated people than not vaccinated
– In the early stages of a variant like Omicron, cases are linked to travel (which you must be vaccinated to do)
– A large percentage of the unvaccinated are rural, and have lower risk of being around people that travel
– Unvaccinated people are less likely to report a positive test through government PCR testing
– Overall positive cases are significantly higher than what’s currently reported (how many multiples?)
All good points, Matt. There are many limitations to our state of knowledge.
Laurie, thanks for your comments. I am a little concerned that some of the spikes could be a result of the lagging. Ontario is keeping track of their triple vaxxing to some degree, but we aren’t quite ready for analysis yet on this good question.
Thanks for the great update, Lee. This is obviously a breaking story with new data coming in quickly. Is there any data available yet to show the effect of boosters on VE for both new cases and hospitalization? There are some noticeable features in your graphs — for example the significant spike in “hospitalization vaccinated ratio” in November — that would be interesting to see plotted against rates of new cases of different strains and vaccination rates (by number of shots).