
My passion in science over the past 8 years has been atmospheric physics and oceanography, and here in my first article for BIG Media Ltd. I will focus in on a recent publication and empirical data that emphasize forces governing CO2 as a natural constituent of our atmosphere.
In this mini-literature review, I will walk you through the analysis that I have done to confirm the findings of a fascinating study by Chatterjee et al titled Influence of El Niño on atmospheric CO2 over the tropical Pacific Ocean: Findings from NASA’s OCO-2 mission.[1]
This 2017 publication by Chatterjee et al is one of the first studies to come out shortly after the remote sensing satellite called OCO-2 was commissioned just in time for the 2015/16 super El Nino.
The timing of this satellite`s launch allowed the first high-resolution glimpse from orbit into natural CO2 emanating from the Pacific tropics on the lead up to and following a major El Nino (warming) event in the Pacific tropics.
The new OCO-2 satellite was able to distinguish between declining CO2 emanating from the Pacific tropics versus increasing CO2 emissions from forest fires that developed in the Indo-Pacific region during the 2015/16 El Nino.
The authors claimed that because the trade winds decelerate during El Ninos, their suction force (i.e., Ekman Pumping) on the tropical ocean surface decreases or stops pulling carbonic-acid-enriched deep water up to the surface.
I believe we can demonstrate that the Pacific equatorial zone is a major source of CO2 controlled by the trade winds and, ultimately, the El Nino Southern Oscillation (ENSO).
In oceanography, we call this upwelling of cold, acidic deep water by the trade winds, Walker Circulation. (Figure 1)
We are familiar with a can of pop or beer going flat once the can is cracked; apparently the physical chemistry at work in Walker Circulation is much the same.
As a physical chemist by formal training, I felt compelled to assess if the equatorial trade winds are a leading factor in the rate of CO2 being emitted from the Pacific tropics.
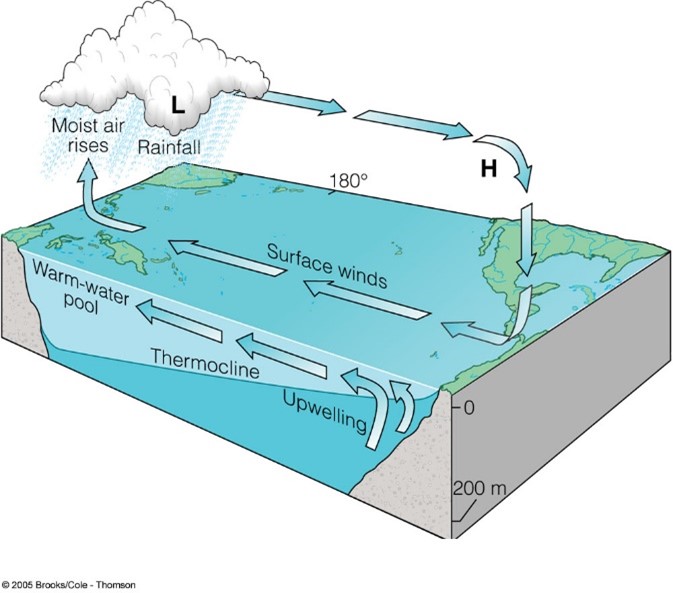
Figure 1 – Walker Circulation in the Pacific tropics.
To start, I selected two stations on either side of the Pacific equatorial latitude.
I hypothesized that if the surface beneath the convergence of both hemispheres’ atmospheres along the equatorial zone is a major emission source, then this emission source signal should be detectable at global monitoring stations in either hemisphere.
In this experiment, I use the two longest operating CO2 monitoring stations, the Mauna Loa station in Hawaii and the South Pole monitoring station in the Antarctic.
Figure 2 shows the CO2 concentration versus time or Keeling Curves from both stations from the late 1950s to present at two-time scales to aid the eye, and as the embedded legends outline, I use consistent colour coding to delineate data from each station.
Note that modern measurements of CO2 concentrations are done using IR spectroscopy and real-time, on-line sources of data that are publicly available as monthly averaged data series.[2]
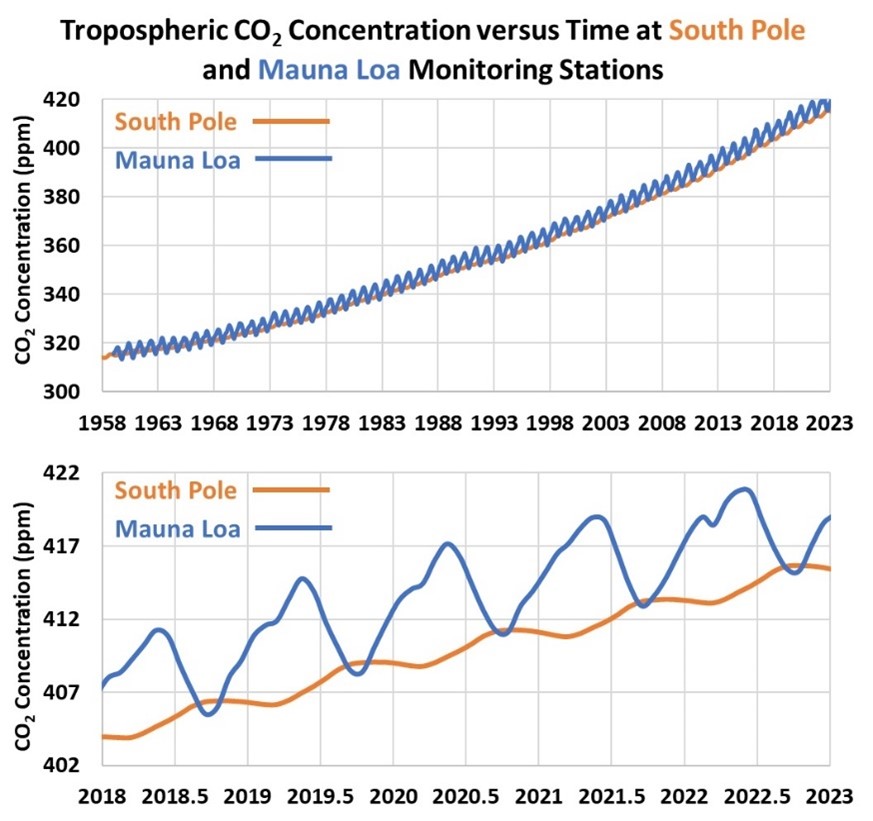
Figure 2 – Monthly average CO2 concentration versus time measurements from the South Pole and Mauna Loa stations.
The phase shift seen in both measurement time series is said to highlight the influence of the seasonal cycle in either hemisphere, with the terrestrial plant kingdom inhaling and exhaling CO2 over the course of the year as a function of oscillating sunshine intensity.
The fact that both time series are out of phase is expected since the Northern Hemisphere`s summer is the Southern Hemisphere`s winter.
Likewise, the difference in amplitude for the annual cycle at the South Pole versus Mauna Loa arises from the fact that there is more land versus ocean surface area in the Northern Hemisphere than in the Southern Hemisphere.
In this sense, the concentration versus time measurement is a reflection of sunshine-driven photosynthesis and late-season organic matter decay once foliage falls to the ground.
Most people are familiar with the overall increasing concentration trend, which is historically attributed to human influence.
Now, to go from a concentration versus time to emission rate versus time, we use some straightforward physics and the following steps:
-
- Apply a 12-month rolling average to filter out the 12-month seasonal cycle from both the South Pole and Mauna Loa time series.
- Apply a month-over-month difference or first derivative of the monthly averaged time series.
- Multiply the derivative by a factor of 7.8 to convert from parts per million (ppm) per month to giga-tonnes per month.
We call this new time series the tropospheric CO2 growth rate versus time, which is a measure of the rate of change in concentration that develops at frequencies just beyond the seasonal cycle.
This is the time scale of ENSO dynamics (i.e., interannual rate of change).
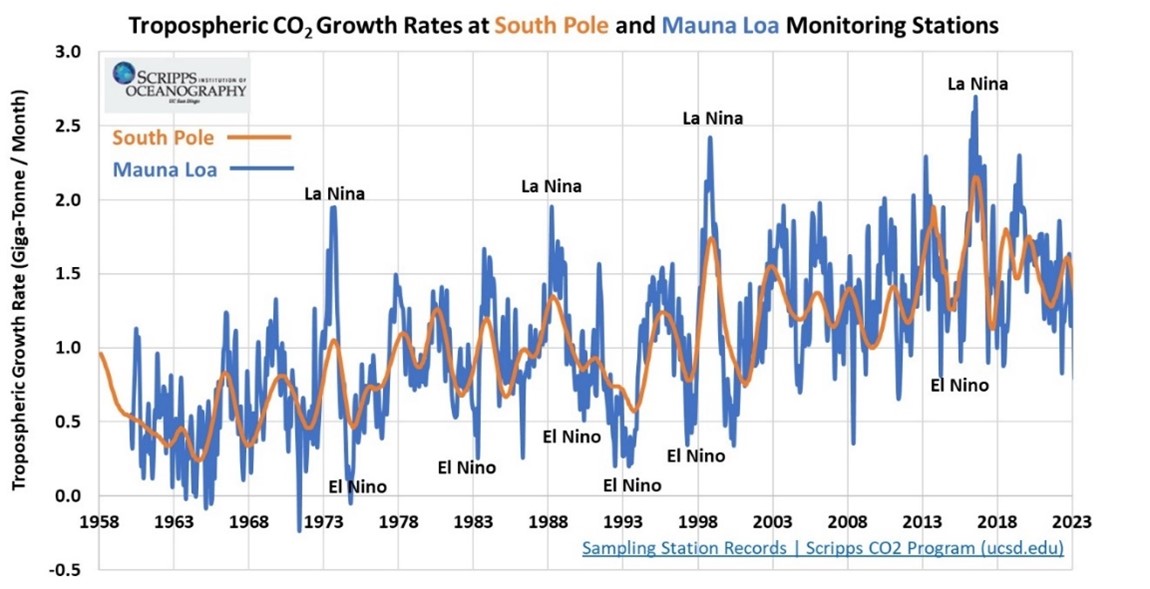
Figure 3 – Tropospheric CO2 growth rate versus time as measured at the South Pole and Mauna Loa monitoring stations.
Figure 3 shows that application of this treatment results in the elimination of the temporal phase shift between the South Pole and Mauna Loa time series and that the two time series are positively correlated.
This is of huge significance.
This single observation is a confirmation that the Pacific equatorial zone is the dominant area source of CO2 emissions.
As stated earlier, the Pacific equatorial zone marks the location of the convergence of both hemispheres (Figure 4). Thus, counter rotating atmospheric circulation (aka Hadley Cells) within this zone acts to disperse off-gassing CO2 to higher latitudes in either hemisphere.
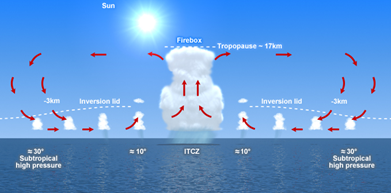
Figure 4 – Cross-section illustration of the Hadley Cell Convergence Zone within the Pacific tropics, also known as the Intertropical Convergence Zone (ITCZ).
This treatment also shows that the derivative does not fully detrend either time series and that a positively increasing baseline remains for both after 1975.
The higher amplitude and noise of the tropospheric CO2 growth rate as measured at the Mauna Loa relative to the South Pole station is noteworthy. This feature may reflect the relative differences between land and ocean in either hemisphere; like the concentration versus time series shown in Figure 2.
An examination of sea surface temperature records for the Pacific tropics shows that the lower emission rates are indeed associated with El Ninos (warming), and the higher emission rates are associated with the La Nina (cooling) phases of ENSO.[3]
Thus, Figure 3 confirms Chatterjee et al`s claim that the tropospheric CO2 growth rate declines during El Ninos and increases during La Ninas.
Next, to test the claim that decelerating trade winds are positively correlated with declining tropospheric CO2 growth rates, I used the same detrending techniques used in Figure 3, on the Pacific trade winds (aka easterlies). Easterly wind speeds were obtained using NCEP Reanalysis[4] from the Pacific tropics between 5 degrees N to 5 degrees S and 240 degrees W to 90 degrees W, and at 850 mb (1,500 metres).
Figure 5 illustrates the positive temporal correlation between the trade winds and the tropospheric CO2 growth rate at the South Pole monitoring station over the time span of 1965 to 2000.
Note that the first derivative detrends the trade wind speed, as seen by having a near-zero trend line along the x-axis. Note that a positive derivative represents an acceleration, and a negative derivative is a deceleration.
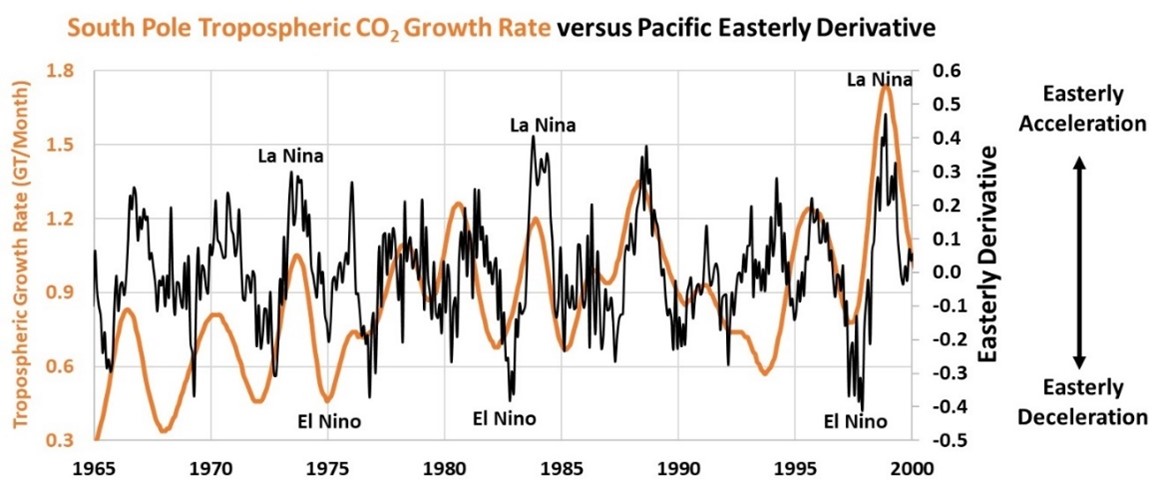
Figure 5 – Tropospheric CO2 growth rate at South Pole versus the first derivative of the Pacific trade winds.
The final step taken to quantify both the correlation and temporal alignment of the three derivative time series in this article was to use cross-correlation statistics. Figure 6 shows the cross-correlation analysis of the phase difference between the peak values of the South Pole and Mauna Loa derivatives (SP/ML), as well as the South Pole and Pacific trade wind speed (SP/PTWS) derivatives.
As the cross-correlation analysis has both of the SP/ML and SP/PTWS peaks centered along the Tau = 0 month axis, we can confidently state that the global tropospheric CO2 growth rate decreases as the trade winds decelerate. The absence of a lag between these three derivatives, suggests the time scales of these processes are significantly shorter than a month.
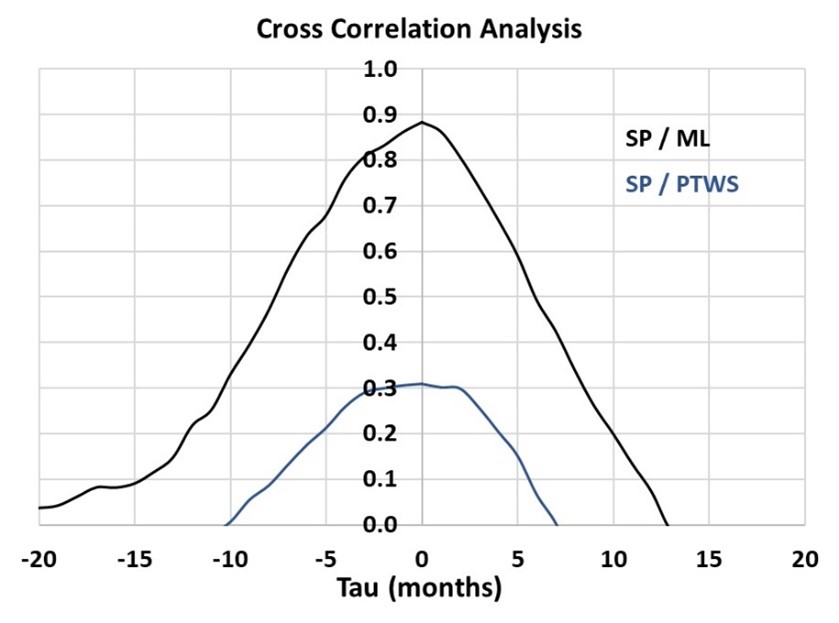
Figure 6 – Cross-correlation analysis of the South Pole and Mauna Loa (SP/ML) tropospheric CO2 growth rates and the South Pole tropospheric CO2 growth rate versus the derivative of the Pacific trade wind speed (SP/PTWS).
The stronger of the two positive correlations is the SP/ML relationship, which would make sense as the correlation analysis is comparing two like parameters that are representative of the same area emission source.
After conducting this analysis, I agree with Chatterjee et al by likewise stating that Walker Circulation is the control knob on the rate by which the tropospheric CO2 growth evolves over interannual time scales.
In closing, I acknowledge that Chatterjee et al`s work highlights that CO2 is intimately associated with the global oceanic overturning cycle.
In essence, the oceanic overturning cycle functions as a solubility pump for CO2.
While it is well known in oceanography that the ocean conveyor belt downwells at higher latitudes and upwells in lower latitudes, such as the Pacific tropics[5] (5), few recognize the paradox associated with tropical upwelling of carbonic-acid-enriched deep water dictating the tropospheric CO2 growth rate.

The unanswered question – why does the tropospheric CO2 growth rate exhibit Walker Circulation dynamics if just 10 years ago atmospheric CO2 was lower than today?
I will continue to explore this topic in my next article.
References:
[1]Influence of El Niño on atmospheric CO2 over the tropical Pacific Ocean: Findings from NASA’s OCO-2 mission | Science
[2] Sampling Station Records | Scripps CO2 Program (ucsd.edu)
[3] Climate Prediction Center – ONI (noaa.gov)
[4] Monthly Mean Timeseries: NOAA Physical Sciences Laboratory
[5] Meridional Overturning Circulation (noaa.gov)
(Dr. Joseph Fournier – BIG Media Ltd., 2024)


I am surprised that you are oblivious to the Suess effect which attributes the 140ppm increase in atmospheric CO2 over the past 2.5 centuries to burning of fossil fuels.
That mechanism is well understood .
Part II will show that carbon-12 isotopic enrichment we see in the atmosphere is related to variable rates of carbon-12 enriched deep water upwelling in the Eastern Pacific during La Nina events, when the Easterlies are at their maximum. Isotopic analysis of carbon-14, 13, and 12 in deep water along the East Pacific Rise, directly beneath the Pacific Cold Tongue region, likewise show that carbon-13 and 14 is depleted.
The Suess Effect is a mainstream view. I am not proposing a mainstream perspective.
Thanks for your comment.
https://www.climate.gov/news-features/climate-qa/how-do-we-know-build-carbon-dioxide-atmosphere-caused-humans
http://www.jamespowell.org/Stuff/Ourfault/Ourfault.html
Thanks Francisco! Going to need to focus hard on Part II to get to the heart of the matter in the most elegant and simple manner.
As always, momma nature proves how much of a little speck we are compared to her.
Excellent article!