
There is so much written about humanity’s energy transition in the 21st century, and many of these articles, blogs, and studies are informative, examining different aspects of incredibly complex energy projects and processes around the world. But others are thinly veiled advocacy pieces, pushing viewpoints motivated by the authors’ interests. And, of course, in this era in which anyone can air their views online without oversight, there is a great deal of misinformation floating around.
So how does the interested reader extract factual, unbiased, and realistic views of how energy might be produced in the coming decades? It is not easy, particularly if you are new to the subject. Here is one angle.
Some people start by looking at who wrote the piece and what their interests appear to be. For example, some dismiss anything written by anyone who appears to be associated with the oil and gas industry. I have had many people tell me that I am a “shill of the oil and gas industry” because they see on my LinkedIn profile that my company consults to oil and gas companies – and because they don’t want to read my article, or have read it and didn’t like it but don’t have the knowledge to respond. They seek out what they want to see, and ignore my academic work on energy transition, and that most of my current work is in helium, lithium, geothermal, and CCS – not oil and gas.
The people who disagree with me and do know what they are talking about actually present their arguments for debate – but that happens all too rarely.
When you think about it, there are precious few people that understand a field of study or an industry without having done some work in it. So, if you simply discount experts by linking them to things you do not like, it’s going to be hard to learn much, because you will discount just about everybody who knows anything substantial.
What about learning from advocacy organizations? There are many out there, and many advocate with facts and arguments worth consideration. That said, I have to admit that I am immediately cautious of anything I see from some advocacy groups because of their overt ideological leanings. For example, in Rocky Mountain Institute’s (RMI) mission statement:
“In recent years, the rise of the climate crisis and the need to transition global energy systems away from fossil fuels has amplified the need for and impact of our mission, to help usher the world toward a clean, prosperous, and secure low-carbon future for all.”
Carbon Tracker is a little more subtle, but there, too, the only available energy solutions exclude oil and gas:
“We recognise that there is a limited global ‘carbon budget’ of cumulative emissions that must be respected to avoid overshooting 2˚C and destabilising the global climate. Our view is that capital markets are failing to align the capital allocation process, exposing the owners of fossil fuel companies – their shareholders – to potential lost value.”
So, should I ignore everything RMI and Carbon Tracker publish about energy solutions because of their missions to eliminate fossil fuels? And should anti-oil folks ignore everything I write because they perceive bias, even where none exists?
The answer is no – if you read only what you think you are going to agree with, you are building an echo chamber, where your own perceptions and biases are reinforced and exclude new thoughts that might improve knowledge and understanding.
So what can we do? We should read a wide variety of articles, and we should examine each critically – whether we think the writer is an oracle of truth and wisdom, or whether we believe they are just advocating for their pet cause. In either case, they may have something new or interesting to say that could improve our knowledge base.
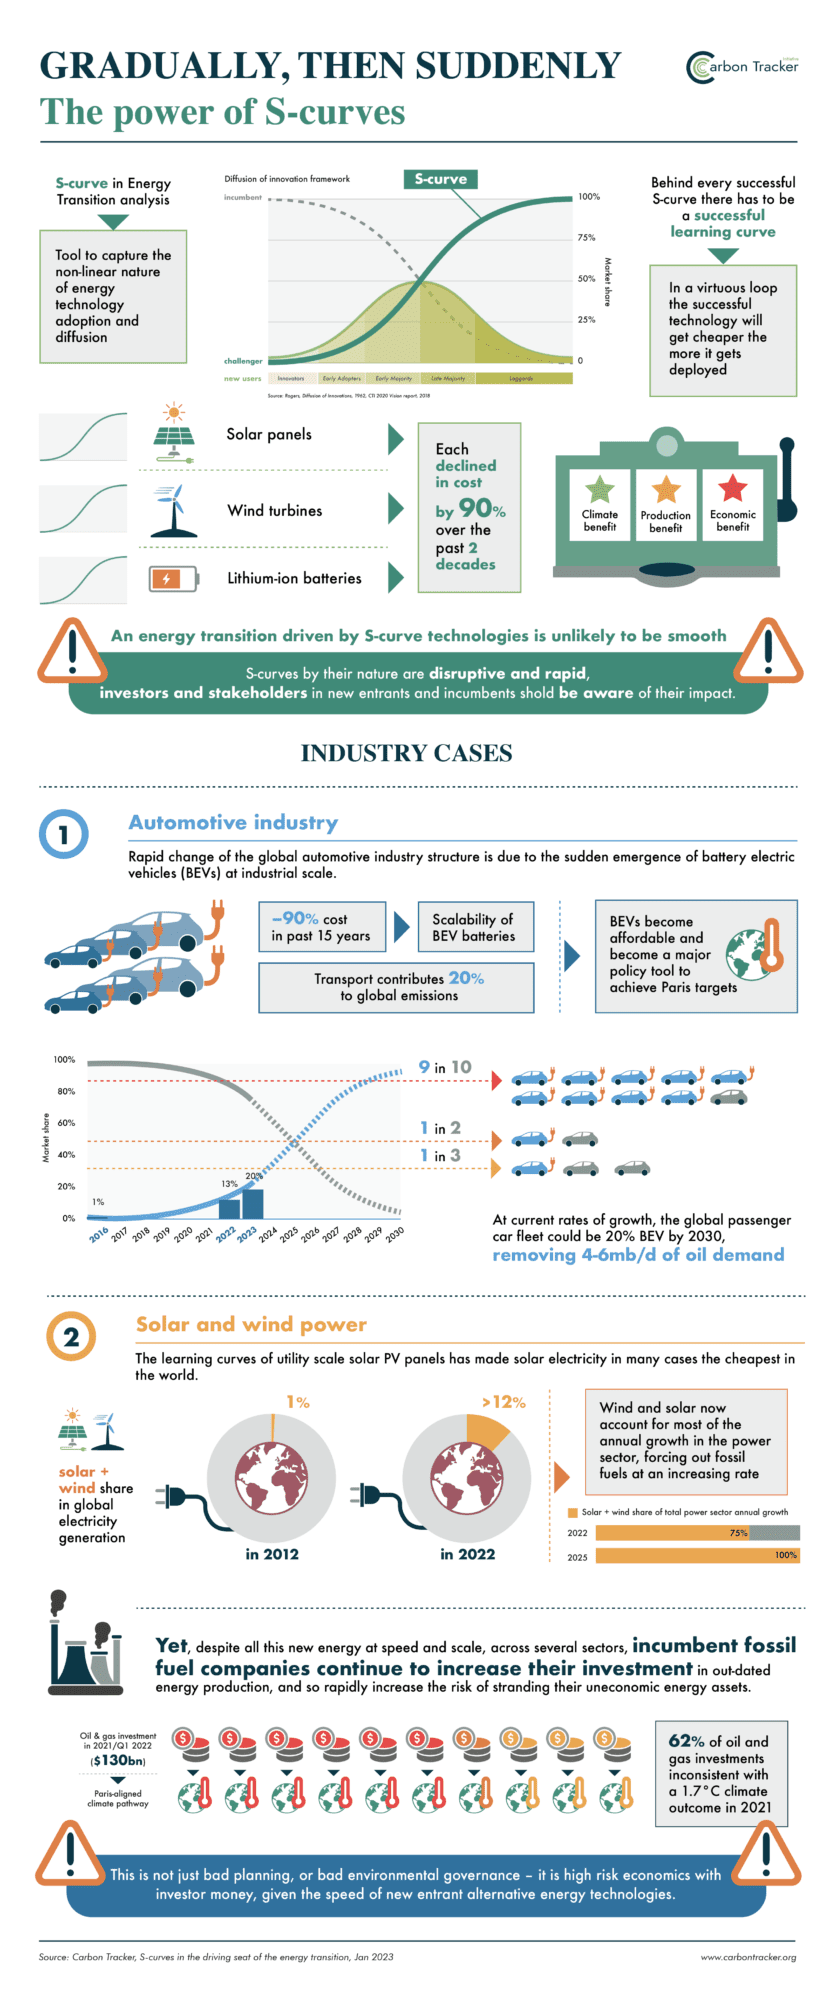
Let’s take an example from a recent blog by Carbon Tracker: S-curves in the driving seat of the energy transition. It asserts:
“The energy transition may well be determined by the phenomenon of S-curves. This is because the future energy system will be characterised by manufacturing technology, not extractive fossil fuel projects.
The S-curve is a well-established phenomenon where a successful new technology reaches a certain catalytic tipping point (typically 5-10% market share), and then rapidly reaches a high market share (i.e. 50%+) within just a couple more years once past this tipping point.
Manufacturing technologies improve quickly by S-curves, scalable learning-by-doing techniques based on thousands and thousands of repeated parts and assembly.
Extraction projects are almost the opposite: one-off large scale complex efforts that are difficult, potentially impossible, to replicate and improve.”
There’s a nice infographic to illustrate the S-curve (Figure 1). Note that it is an idealized model, where the implication is made that solar panels, wind turbines, and lithium-ion batteries will follow their S-curve shape because their costs have declined over 20 years. No actual market-share data is shown.
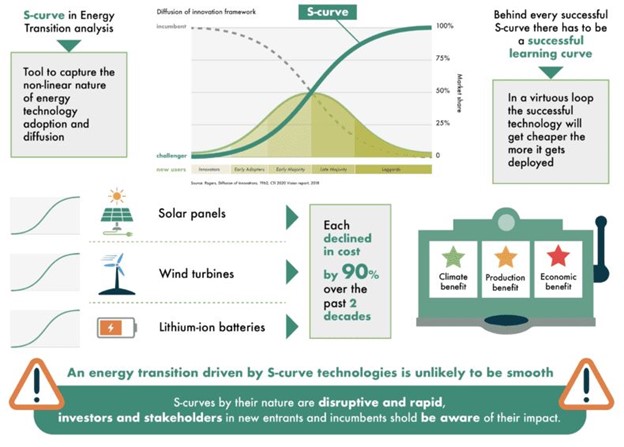
Figure 1 – “S-curve in Energy Transition analysis”
Figure 2 attempts to make the case that battery electric vehicle sales fall into an S-Curve distribution, concluding that 9 in 10 new vehicles sold in 2030 will be BEVs.
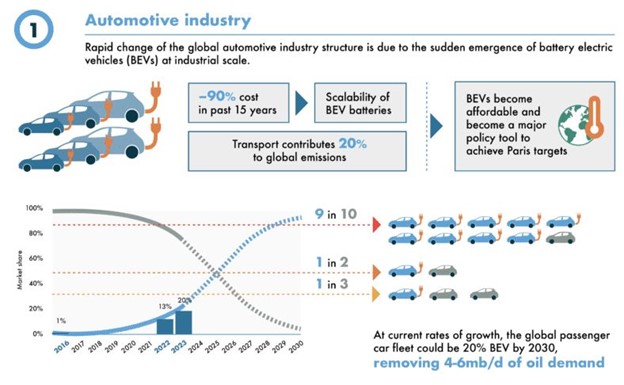
Figure 2 – Battery electric vehicles at industrial scale.
Wow! Is this a well-thought-out application of an established model, backed by sufficient data to convince us that battery electric vehicles are a disruptive technology that will dominate the market in a few short years?
Let’s do a little research and some critical thinking. S-curves are “widely used in production organizations to record, monitor, analyze and control various performances by measuring parameters over time. They provide a quick overview of projects’ current status, comparisons between the baseline or targets, as well as the forecast for future periods.” (S Curves for Monitoring and Reporting Project Progress – Definitive Guide)
Properly constructed S-curves can take many shapes, as they are created by plotting real data against time, and most approach 100% at the end because most projects are completed.
But there is no body of research establishing S-curves as a definitive model for adaptation of new technologies.
Figure 3 shows rates of adoption over time for several disruptive technologies, all of them showing rapid growth resembling RMI’s idealized S‑curve. But these are examples of truly disruptive new tech that offered consumers things they did not have before, and even some of these have peaked well below 100% adoption (including video games, PCs, MP3 players, and HDTV).
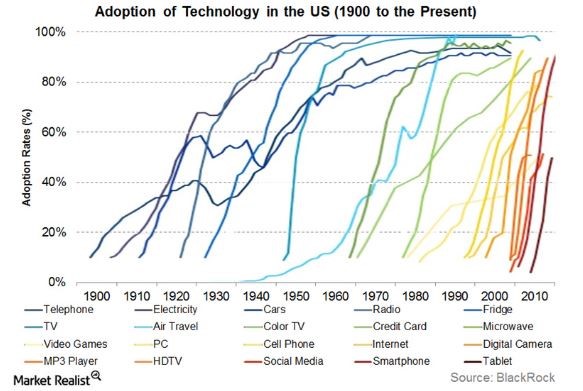
Figure 3 – technology adoption.
Any study on a wider range of new technologies (please let me know if such a study exists) would show that most new tech finds niche markets and follows some sort of curve plateauing at relatively low values (Figure 4), or even falling back after the initial excitement (think cassette tapes and the Sony Walkman).
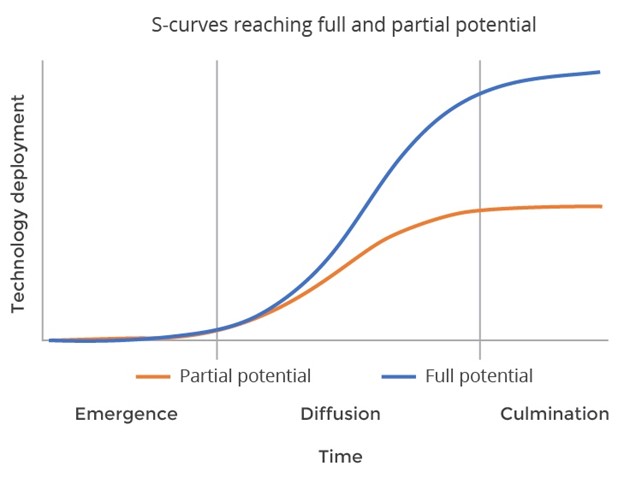
Figure 4 – S-curve potential.
Back to the RMI story, Figure 1 plots no data, and is simply idealization. Figure 2 plots one data point – 1% BEV market share in 2016. Carbon Tracker “expects” 13% market share in 2022, but does not have data to support that expectation. Obviously, the 2023 value of 20% is not a data point but a wish that gives the author an excuse, along with the 2022 “expectation”, to turn the curve up into the early stages of the desired S shape. So just a little critical examination shows us that Carbon Tracker has produced “sciencey”-looking figures with no data to support them.
Carbon Tracker says they can apply their idealized S-curve to BEV sales because they are a manufacturing process, as opposed to an extractive process, which in their words comprise “one-off large scale complex efforts that are difficult, potentially impossible, to replicate and improve.” Yet one of the most significant barriers to BEV growth is the availability of lithium-ion batteries, which rely on extraction of lithium at massively accelerated rates in the very near future, as I discussed a couple of months ago in BIG Media Critical minerals to play major role in emerging technologies.
Figure 5 shows one of the more conservative projections of lithium supply and demand to 2030 – almost 600% demand growth in eight years in order to manufacture the batteries needed for BEVs.
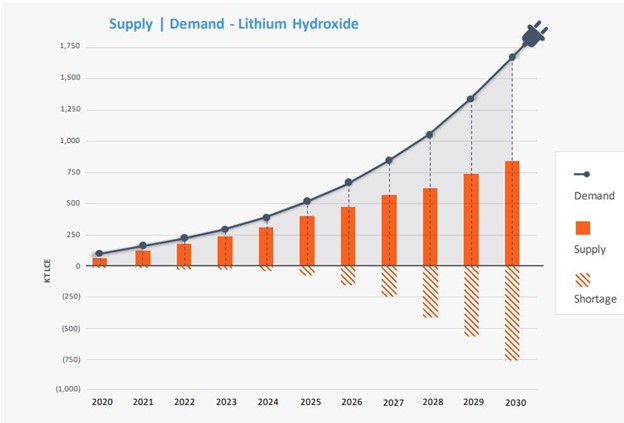
Figure 5. Projected supply and demand for lithium hydroxide through 2030. Note the enormous shortfall of supply versus demand for battery production. (From E3 Lithium Corporate Presentation February 2023, The Future of Canadian Lithium)
None of the Figure 3 technology growth curves was constrained by availability of resources – but BEV growth depends on impossible growth of lithium extraction. Even if the Carbon Tracker S-curve idea had some scientific foundation, claiming that BEV growth should follow a manufacturing curve instead of an extractive resource curve is clearly wrong.
So, in this case, my skepticism around Carbon Tracker’s blog is well founded. A little critical thinking blows the entire thesis out of the ground. In fact, I have repeated this type of critical analysis many times with Carbon Tracker, and they repeatedly fail to meet the standard of scientific, objective analysis. But I will never dismiss what they write, or what other advocacy organizations write, without critically examining what they present.
My recommendation is to subject to critical analysis anything you read – about energy transition or any other important subject. You do not need to be an expert; you just have to be willing to think, look at the data, and maybe do a little research. You will find some gems worth learning, but you will need to paw through a lot of rhinestones to get there.
Figure 1. RMI infographic illustrating their conceptual S-Curve, Gradually, Then Suddenly
Figure 2. RMI infographic illustrating application of the idealized S-Curve to battery electric vehicle sales, Gradually, Then Suddenly
Figure 3. Adoption rates of technologies in the US, Transition to EVs: set to climb the S-curve in the next decade
Figure 4. S-Curves reaching full and partial potential, Electric vehicle “S-curve” puts global uptake in line with Paris goals
Figure 5. Projection of global lithium demand from 2019 to 2030
(Brad Hayes – BIG Media Ltd., 2023)

