In a series of recent articles, the Canadian province of Ontario’s COVID data has been examined as a proxy of the Omicron variant’s surge for other jurisdictions in North America. In our last update on this series – Omicron update: vaccine effectiveness against hospitalization drops sharply – we noted that the vaccine effectiveness (VE) against cases remained negative and that the VE against hospitalization had dropped abruptly.
This update, using data released Jan. 5, shows four key things:
- VE against hospitalizations has stabilized for the last 5 days at just above 40%.
- VE against ICU admission has dipped marginally, but is currently holding at the 80% level.
- The ratio of ICU admissions to cases continues dropping, which supports the possibility that Omicron is effectively less severe than previous strains.
- We make a prediction for ICU load in Ontario, which may have a local peak in 11 days.
VE update
VE is an estimated number, and there is a small amount of latitude in how it is calculated, given that choices must be made on what population is considered to be vaccinated, and how to handle partially vaccinated persons. This was discussed in detail in Taking a long-term view of the decision to vaccinate. We use a consistent procedure.
In the near future, estimates that consider the effect of booster shots may be feasible.
As described in this article Understanding vaccine effectiveness and breakthrough, these VE calculations follow the screening method, which uses readily available public data. The accuracy of the estimations depends on the integrity of that data.
Using data released on Jan. 5, we update the VE against cases, hospitalizations, and ICU admissions.[1][2]The VE for ICU admission has dropped somewhat but not materially, and the VE to hospitalization has held for the last 5 days.
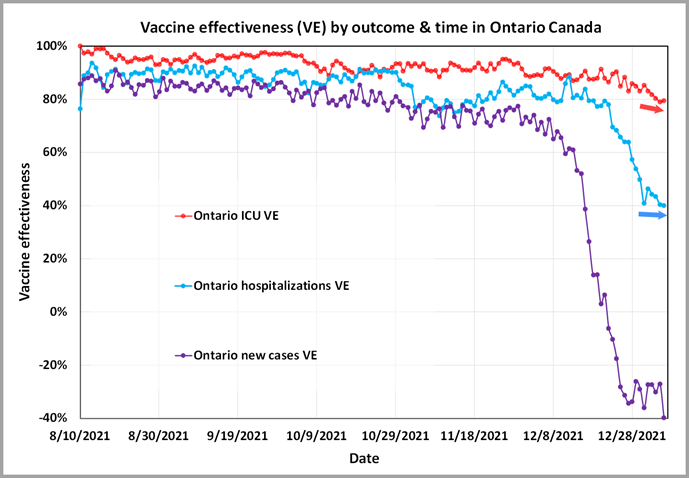
Updated data in Ontario as of Jan 5 shows vaccine effectiveness against hospitalization has dropped to a low of 40%, and has stayed at about that level for 5 days. The vaccine effectiveness against new cases is below zero. The ICU vaccine effectiveness dropped moderately and is holding at about 80%.[3][4]
New cases
Reported new cases increased sharply to a local high after Christmas, as indicated in the updated chart below. There are many factors that prevent us from suggesting that the drop in new cases is a sign that infections have decreased overall (e.g., Ontarians were focused on family gatherings, or the relatively mild symptoms translate to a smaller percentage of infections being reported). This may simply be a local high related to the holiday season. There could be another local high due to new year’s gatherings as well.
The question of the severity of Omicron becomes more important as the case load rises.
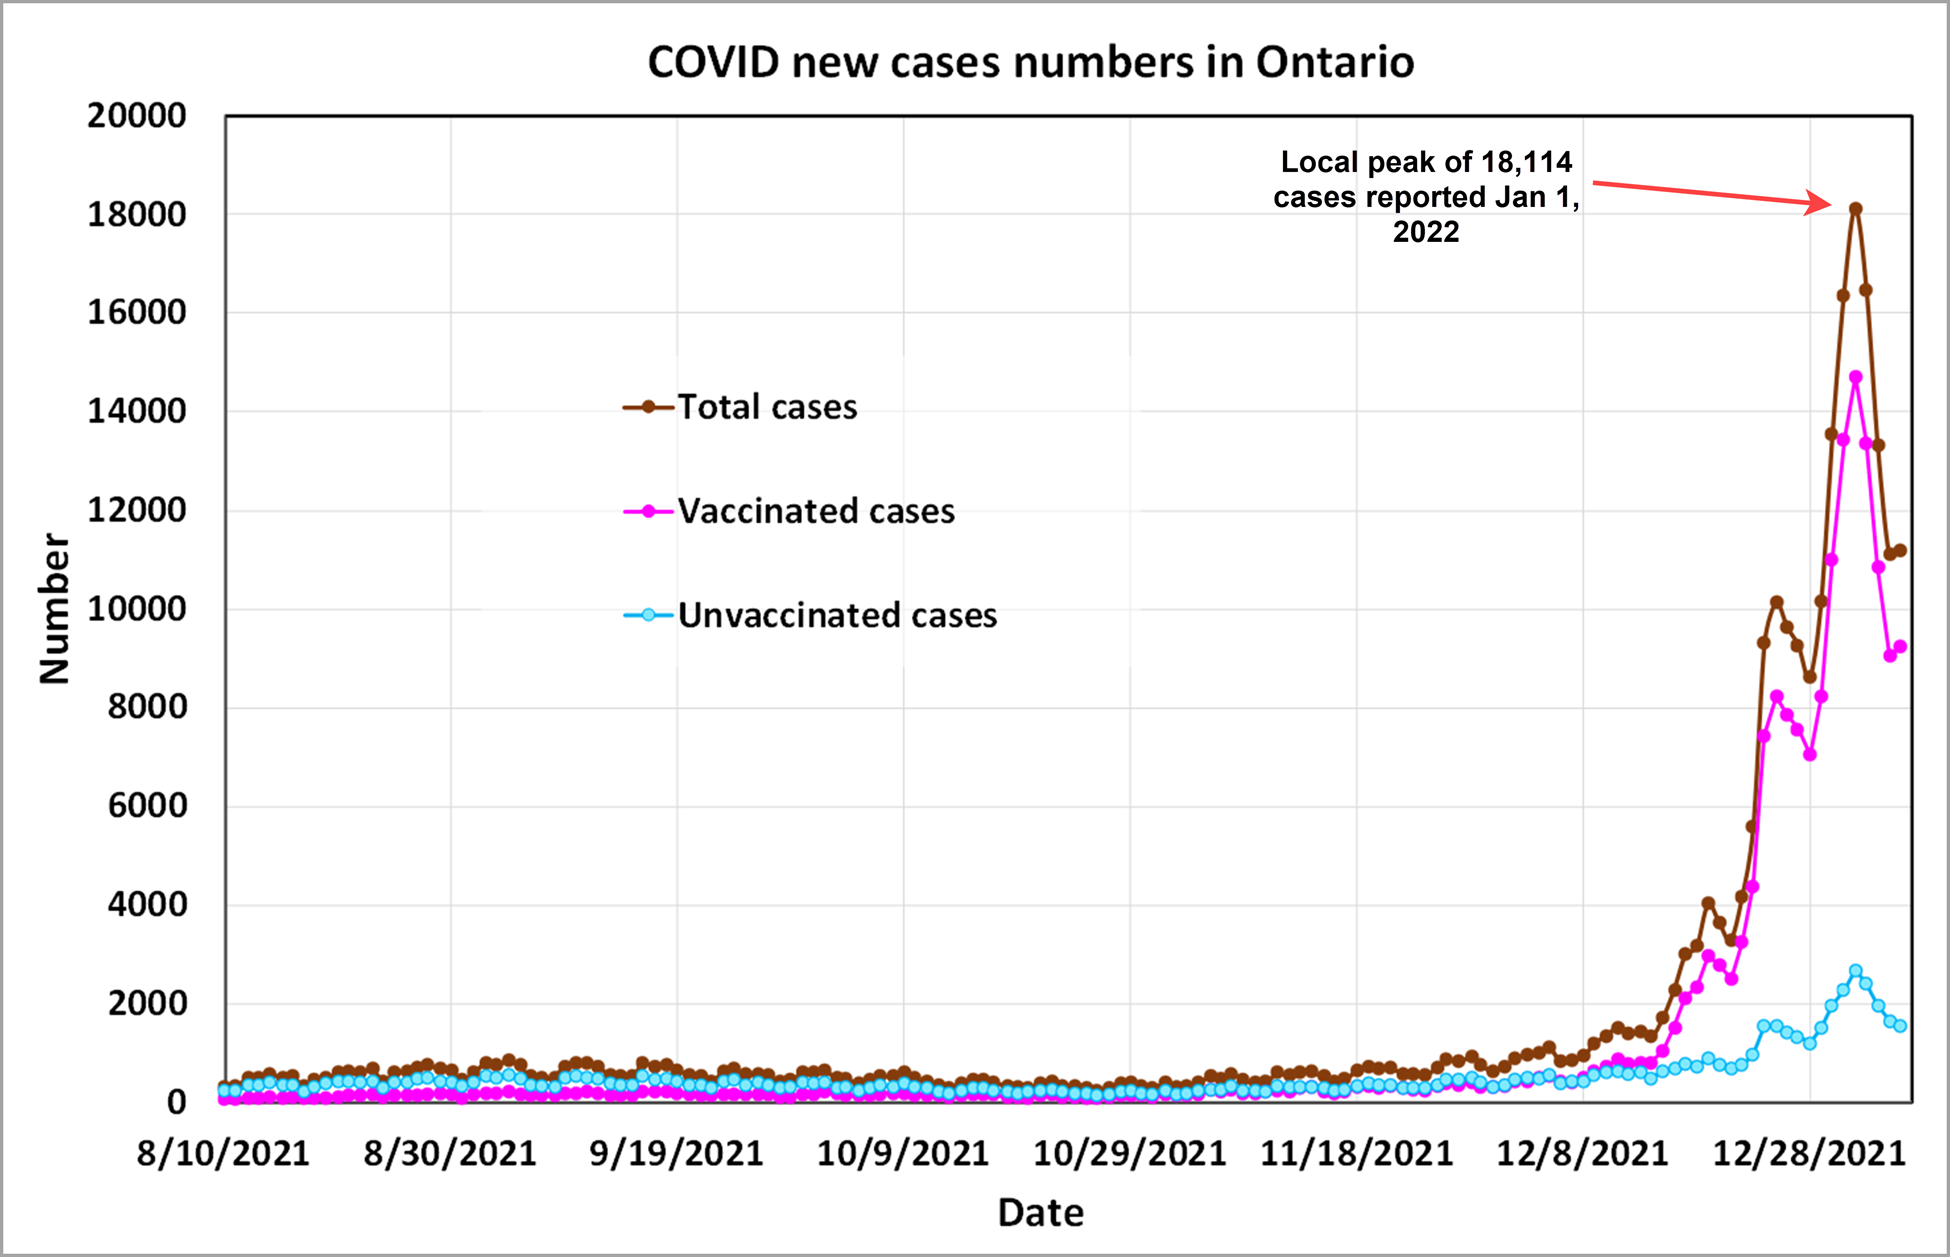
Updated case numbers in Ontario as of Jan 5 show that case numbers among the vaccinated surged abruptly. ICU trends are not shown here due to how much lower they are in magnitude to new cases.[5][6]
Ratio of severe outcomes to cases
As first discussed in the article As Omicron cases surge, impact on health care systems is difficult to predict, we can create ratios of severe outcomes to cases. Because severe outcomes trail cases in time, these ratios must be created with an appropriate time lag. If Omicron is truly less severe, we would expect such a ratio to have a downward trend. The ratios with a two-week lag are shown in the chart below. The ICU ratios are dropping, with vaccinated persons with COVID showing a ratio of less than 3%, from a high of 14% in October and November. This data suggests that Omicron is having a less severe effect.
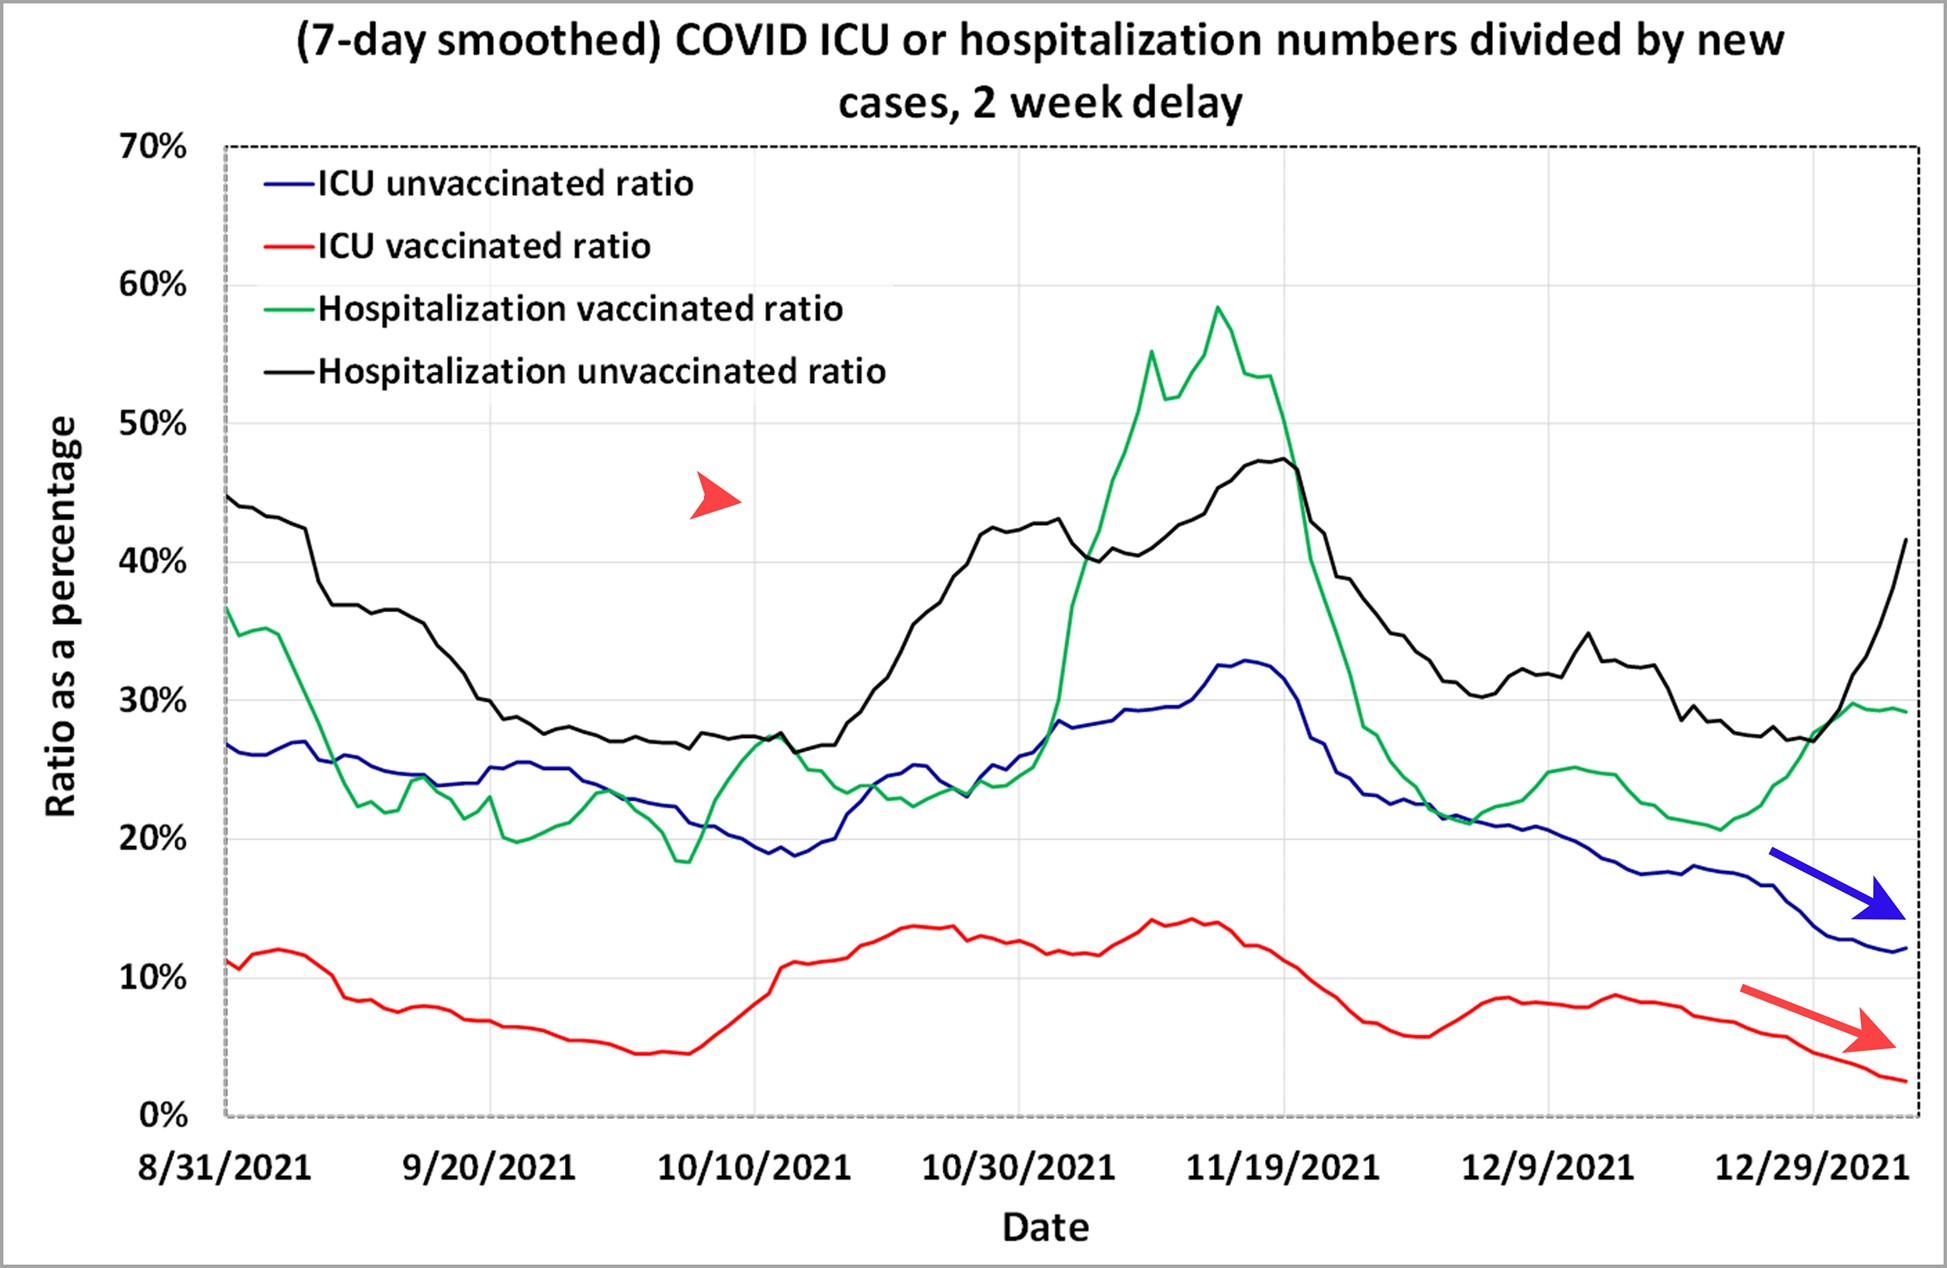
Ratio of the number of new cases being presented to admission to either the hospital or ICU. These ratios are consistent with vaccination status, and have a two-week delay between new cases and either hospitalization or admission to the ICU. The ICU ratios continue to drop.[7][8]
Predicting hospitalization and ICU load
The goal in presenting the ratios above is to determine if Omicron is less severe. According to this data, it may be less severe for ICU admissions. The time lag between symptomatic cases to ICU admission presents an opportunity to predict ICU admissions in the future based on new case data from within the period of the time lag. We create an ad-hoc prediction formula, defined as:
ICU (t+l) = Case (t) * Ratio where t is a particular date, and l is the time lag in days
Where the Ratio used is the most up-to-date ratio of ICU load to cases. The chart of hospitalizations and ICU admissions is shown below with the predicted values for two weeks into the future.
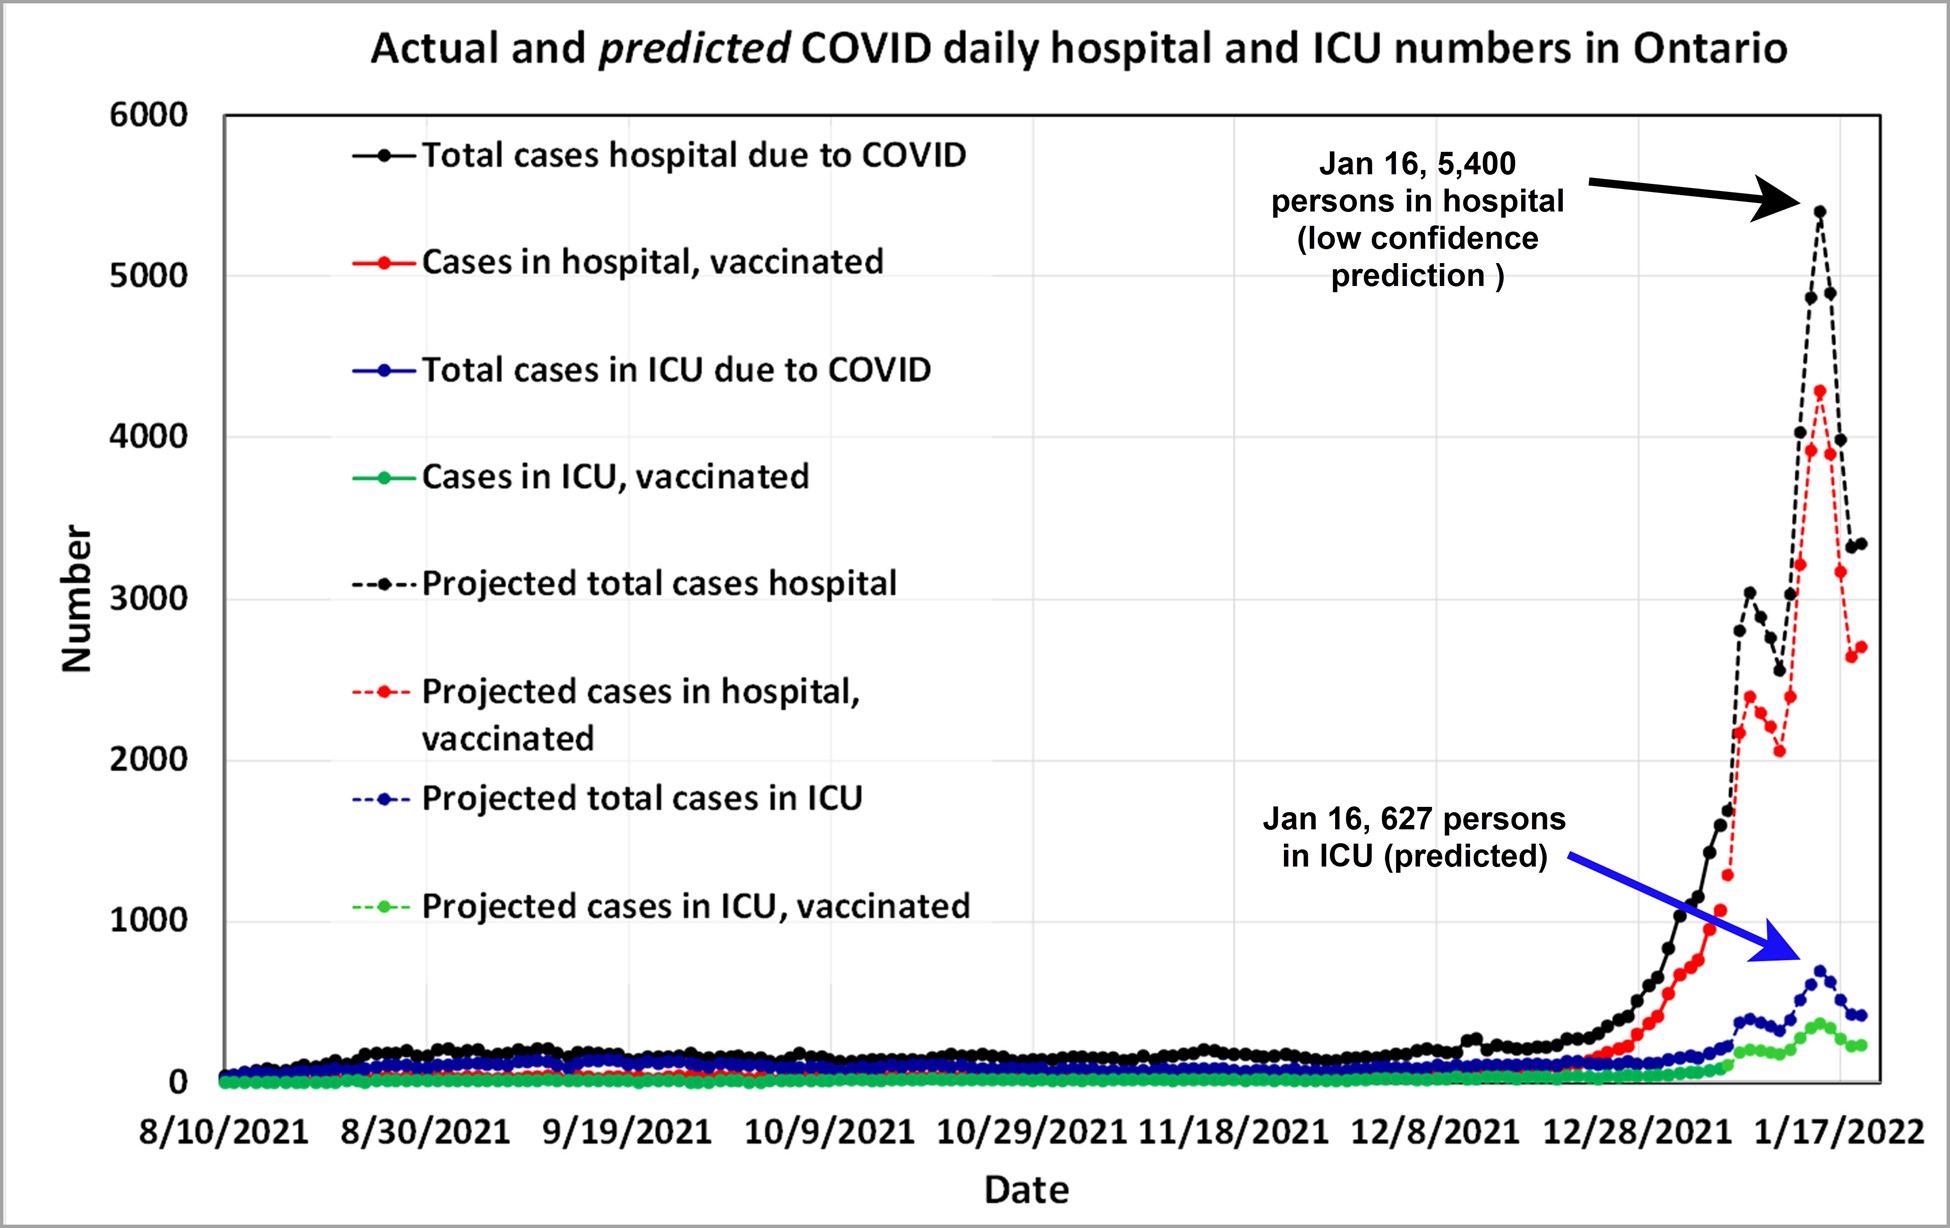
Updated ICU numbers in Ontario as of Jan. 5 show that ICU admissions are rising moderately. Daily admissions to hospitals are rising more sharply. This is consistent with the drop in vaccine effectiveness against hospitalizations.[9][10]We make a prediction of future hospitalizations and ICU admissions based on the two-week previous cases and ratios of cases to these outcomes.
The scientific basis for predicting ICU cases
This approach to predicting ICU load is very simple. It should be viewed as limited by its simplicity and its dependency on the following assumptions:
- That the ratio of ICU load to new cases will remain relatively consistent for the next two weeks.
- That the two-week lag is appropriate.
- That there are no other material variables.
Such a prediction can only be made as many days into the future as the correct lag time of symptomatic onset to ICU admission.
This method has an important flaw: it treats ICU and hospital loads as if they happen instantaneously rather than as an accumulating value with lengthy stays. This may see the ICU and hospitalization falloff fail to materialize as quickly as the chart represents.
Interpretation
We continue to monitor the surge in Omicron cases, vaccine effectiveness, and ratio of severe outcomes. Our presentation of relevant data and interpretation are intended to provide readers with important context on these matters. Our predictions should be viewed with caution, and as a simple exercise in logic.
References
[1] COVID-19 Vaccine Data in Ontario, Ontario Government, January 5, 2022
[2] Hospitalizations, Ontario Government, January 5, 2022
[3] COVID-19 Vaccine Data in Ontario, Ontario Government, January 5, 2022
[4] Hospitalizations, Ontario Government, January 5, 2022
[5] COVID-19 Vaccine Data in Ontario, Ontario Government, January 5, 2022
[6] Hospitalizations, Ontario Government, January 5, 2022
[7] COVID-19 Vaccine Data in Ontario, Ontario Government, January 5, 2022
[8] Hospitalizations, Ontario Government, January 5, 2022
[9] COVID-19 Vaccine Data in Ontario, Ontario Government, January 5, 2022
[10] Hospitalizations, Ontario Government, January 5, 2022
(Lee Hunt – BIG Media Ltd., 2022)