My objective in the second of this two-part series is to introduce a model that I call the Meridional Overturning Mediated Carbon Cycle between the Lithosphere and the Atmosphere.
In Part 1 (Pacific Walker circulation and the tropospheric CO2 growth rate – BIG Media)[1], I emphasized the known role of variable Pacific Walker Circulation in modulating the tropospheric CO2 growth rate (TGR), where the latter is a function of the rate by which carbonic-acid-enriched deep water upwells and off-gases in the tropical Pacific.
The analogy given in Part 1 was a can of beer or soda going flat once opened.
In Part 2, I introduce the idea that ocean-bottom geochemical exchange with the lithosphere is an overlooked and influencing factor in both carbon-12 isotopic enrichment and the growth in atmospheric CO2 as the TGR and deep-water upwelling rates peak during La Nina states.
This model of the carbon cycle, shown in Figure 1 above, deviates from mainstream view[2]by emphasizing the mediating role of oceanic meridional overturning circulation (MOC) in cycling dissolved inorganic carbon (DIC) sourced from both atmospheric absorbed CO2 at higher latitudes and by geochemical exchange with the lithosphere, where it is subsequently off-gassed as the carbon-12 isotope enriched TGR in the subtropical oceans.
The mainstream Carbon Cycle model ignores geochemical exchange between the lithosphere and the MOC.
The X-axis to the left of the vertical axis represents the ocean – atmospheric interface by latitude, and to the right represents concentration for atmospheric , dissolved inorganic carbon (∑[CO2]or DIC), and the isotopic ratio δCO2.
Before delving into a proof of this model, some basic definitions are in order.
Meridional overturning – this includes both atmospheric and oceanic convection along a south to north direction.
[CO2] – represents the atmospheric concentration of CO2, which is highest near the surface.
∑[δCO2] or DIC – represents the total concentration of carbonic acid (H2CO3), bicarbonate (HCO3–), and carbonate (CO32-), which increase in concentration with depth in the ocean.
δCO2 – called the carbon isotopic ratio[3], which represents the carbon-13 to carbon-12 ratio and where the carbon-13 isotope has one neutron more than carbon-12. By convention, a decreasing δCO2 implies carbon-12 enrichment, whereas an increasing δCO2 implies carbon-13 enrichment.
The mainstream Carbon Cycle maintains that the declining δCO2 in the atmosphere reflects the combustion rate of carbon-13 depleted hydrocarbons. My model acknowledges that all forms of geological organic and inorganic carbon are depleted in carbon-13.
Now comes the proof.
Figure 2 illustrates data from two studies that show from both the paleorecord and the modern era, DIC (∑[CO2]) in the ocean is higher at depth and the lowest at the surface. Likewise, the paleorecords show that δCO2 and ∑[CO2] are inversely proportional, which implies that carbon-12 is enriched as DIC increases with depth. Likewise, modern data shows that the pH of sea water decreases with increasing depth.
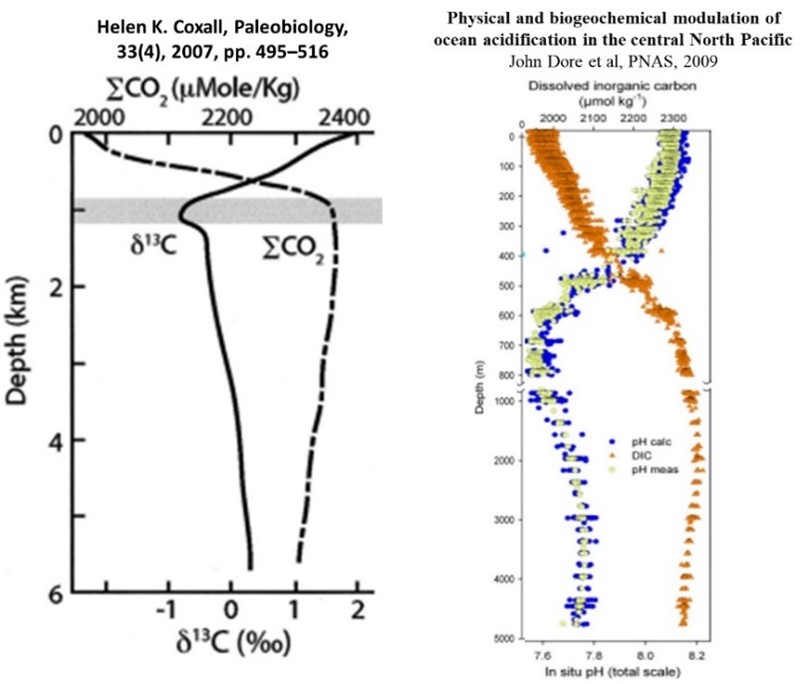
Figure 2 – modern and paleo-data showing DIC, pH, and carbon isotopic δCO2 data vs depth.
The DIC concentration versus depth profile is a function of temperature, where lower temperatures give rise to increasing solubility of DIC.
As colder water has a higher density than warm water, the only way dense water can make its way to the surface is if it is pumped. This is the role of the Pacific easterlies (trade winds), which give rise to a surface suction called Ekman Pumping that is proportional to the surface velocity of the easterlies[4].
As the easterlies move westward in the Pacific Tropics, warm surface water is displaced toward Indonesia and carbonic-acid-enriched deep water is pulled to the surface.
Figure 3 compares the TGR from Maun Loa and South Pole versus the first derivative of the seasonally detrended velocity of the Pacific trade winds.
Recall from first-year calculus that the first derivative of velocity is acceleration; thus, an acceleration of the easterlies is equivalent to an increase in surface suction or Ekman Pumping rate … conversely for a deceleration of the easterlies.
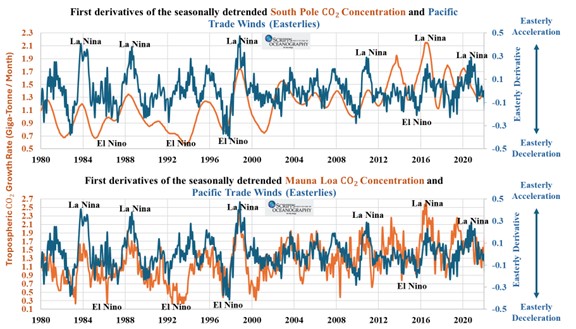
Figure 3 – the tropospheric CO2 growth rate (TGR) at Mauna Loa and South Pole versus the first derivative of the Pacific easterlies.
It is important to bear in mind that Arthur Viterito has shown that the global frequency of magnitude 4-6 earthquakes along mid-ocean ridge spreading zones underwent a threefold increase around the large 1997 El Nino and has been sustained up until present[5]. As well, other researchers have noted the rise in high-energy seismic activity within the East Pacific Rise (EPR), coinciding with major El Nino events[6].
Coincidently, Figure 3 shows that the baseline average TGR increased from 0.95 gigatonnes per month (1980 to 1997) to 1.37 gigatonnes per month (1998 to present) following the 1997 El Nino event.
However, as the TGR is a function of both upwelling water DIC and its flow rate, it is imperative that we examine DIC data in addition to easterly wind speeds across the Pacific tropics.
Figure 4 is an example of such a dataset by Freely et al[7].
The colour-coded scale used for each time series indicates the magnitude for sea surface temperature (SST), easterly wind speed, sea water CO2 fugacity (i.e., f[CO2]), and the sea surface – atmospheric CO2 flux.
The added white-dashed vertical lines from 1997 to 2002 draw attention to the changes between these four variables in the transition between El Nino (warming) and La Nina (cooling) states.
Note the inverse relationship between rising SSTs at 1997 and declining wind speeds, f[CO2] and positive CO2 flux, which then reverses significantly after 1998.
Sea water CO2 fugacity, or f[CO2], is equivalent to atmospheric CO2 partial pressure in physical chemistry, and is a function of DIC and temperature. The unit “μatm” is analogous to “ppm” used to denote atmospheric CO2 concentration, where the latter was 360 ppm in 1997 as measured at Mauna Loa.
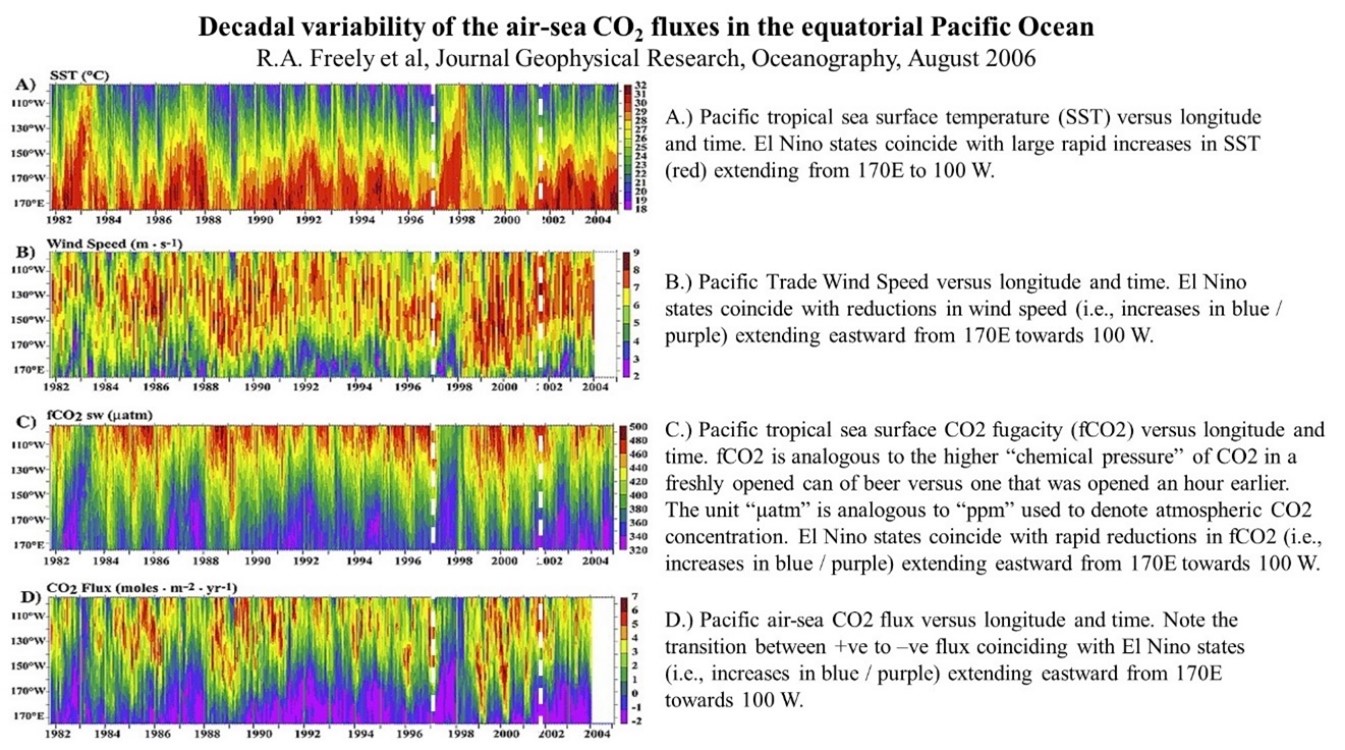
Figure 4 – decadal variability in air – sea CO2 flux in the equatorial Pacific.
When sea water f[CO2] is higher than atmospheric CO2 partial pressure, it is impossible for atmospheric CO2 to be absorbed by sea water. The analogy would be a pressurized balloon, where lower air pressure on its exterior cannot seep through micropores into the balloon to further increase its pressure.
In this study, Freely et al claimed that the TGR increased after the 1997 El Nino event due to both an increase in the f[CO2] of upwelling water and a decadal increase in the Pacific easterlies.
As my model in Figure 1 is a global average, it is time to expand beyond the Pacific tropics.
Figures 5a and 5b illustrate estimates of the annual average geographic distributions of both sea surface CO2 flux and pH, respectively. Red-dashed lines outline known upwelling zones in Figure 5b, which are the largest sources of deep-water carbonic acid off-gassing on the planet.
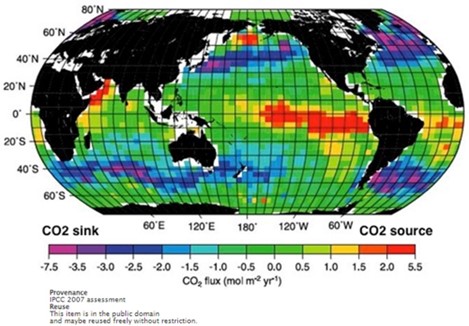
Figure 5a – global sea surface CO2 flux map[8].
In Figure 5a, areas with annual average positive (negative) CO2 flux rates are those where sea water f[CO2] is higher (lower) than the partial pressure of atmospheric CO2.
Note that the eastern Pacific tropics are both the largest oceanic emission source of CO2 and the largest expanse of lower pH surface water. The same underlying atmospheric physics and physical chemistry apply in other upwelling zones shown in Figures 5a and 5b.
Conversely, Figures 5a and 5b show that the higher latitude regions where the air – sea CO2 flux is negative, are where sea surface pH values are the highest relative to deep water upwelling zones and are locations where downwelling of surface water is most active.
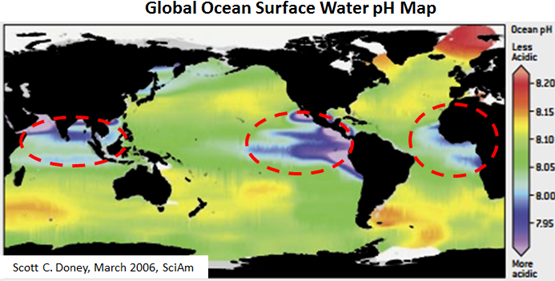
Figure 5b – global sea surface pH map[9].
While upwelling requires Ekman Pumping, downwelling occurs spontaneously as evaporation and the gradual cooling of surface water – en route to polar latitudes from the tropics – act to increase salinity and density.
At sufficient density, higher-salinity water sinks.
This highlights the mainstream view of the oceanic MOC as the global CO2 solubility pump.
My hypothesis expands beyond this view of the MOC by suggesting that Ekman Pumping by Walker Circulation is also geochemically influenced by magmatic and hydrothermal activity occurring within Earth`s most geologically active tectonic field, the East Pacific Rise (EPR) and the Pacific Ring of Fire.
Figure 6 shows that the EPR contains the highest density of the world`s most active hydrothermal fields, which coincidently lies directly beneath the world`s largest deep-water upwelling zone in the eastern Pacific (red dashed circle).
Literature shows that carbon-14 (C-14) isotopic concentration and δCO2 approach their lowest values in the eastern Pacific deep sea near hydrothermal vents that exist along the EPR[10] [11]. Some argue that the anomalously low C-14 of deep water in the EPR zone suggests that there is active carbon cycling occurring between deep water in the eastern Pacific and regional hydrothermal vents[12].
Keep in mind that C-14 is formed by the nuclear reaction between atmospheric nitrogen and cosmic radiation, and has a half-life of approximately 5,730 years. Thus, there is an inverse relationship between deep-sea C-14 content and length of time spent by downwelling water transiting the ocean depths (aka deep-water age).
The mainstream view of the oceanic MOC shows that the youngest age of deep water coincides with deep water formation or downwelling in the North Atlantic as part of the Atlantic meridional overturning cycle. The C-14 content is the highest in North Atlantic Deep Water and the lowest in the north and east Pacific Ocean where deep-water upwelling is driven by Walker Circulation[13].
While the age of deep water moving north in the Pacific varies from approximately 1,600 years in the south to 2,000 years in the north before upwelling in the tropics, deep water in the EPR zone varies between 4,000 and 6,400 years in age. This anomalous age in EPR deep water is said to be evidence of the need to expand the mainstream Carbon Cycle (transport) model to include geochemical exchange with the lithosphere.
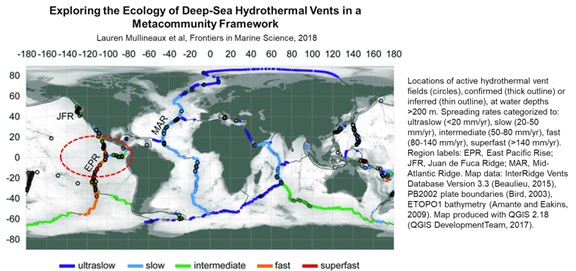
Figure 6. Location of known active hydrothermal vent fields and the east Pacific upwelling zone (red dashed circle).
Now to show how the atmospheric δCO2 varies as a function of variable Walker Circulation.
Figures 7a and 7b show the gradual enrichment of carbon-12 (i.e., declining δCO2 ) in atmospheric CO2, together with the seasonal cycle and Walker Circulation influence on both the monthly average and the first derivatives of the seasonally detrended δCO2 (i.e., dδCO2/dt) at the Mauna Loa and South Pole stations.
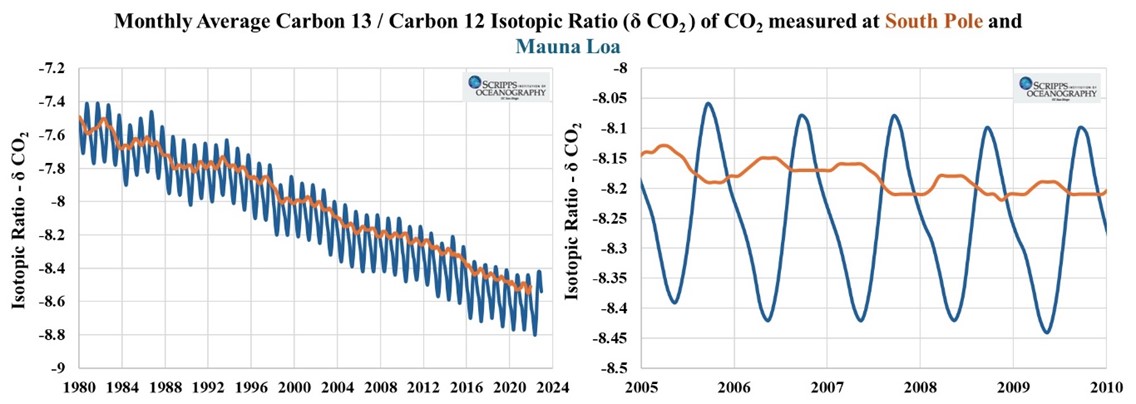
Figure 7a – monthly average isotopic ratio δCO2 at the South Pole and Mauna Loa monitoring stations.
See Part 1 (Pacific Walker circulation and the tropospheric CO2 growth rate) for a description of the physical basis of the seasonal cycle dependence shown in Figure 7a.
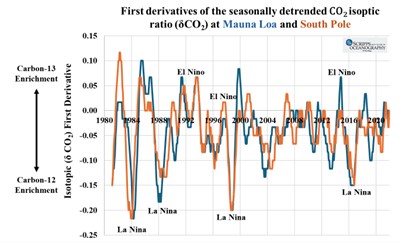
Figure 7b – first derivatives of the seasonally detrended isotopic ratio (dδCO2/dt) at the South Pole and Mauna Loa monitoring stations.
Note that even though the Mauna Loa and South Pole monitoring stations are separated by over 12,000 km, and most anthropogenic CO2 emissions are in the Northern Hemisphere, their dδCO2/dt are remarkably well correlated. Also note that both stations show a maximum negative dδCO2/dt during La Nina events and conversely during El Ninos.
Figure 8 shows that when we compare the TGR to dδCO2/dt at the South Pole, we find a clear negative correlation. The same negative correlation versus ocean depth is seen in Figure 2.
The fact that dδCO2/dt is most negative when the TGR reaches a local maximum during intense La Nina conditions, confirms my claim that La Nina conditions accelerate Ekman Pumping of carbon-12-enriched carbonic acid in deep water to the surface, where it off-gases as CO2, causing δCO2 to trend negatively.
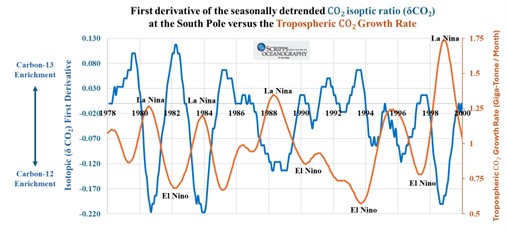
Figure 8 – first derivative of the seasonally detrended CO2 isotopic ratio (dδCO2/dt) and the tropospheric CO2 growth rate (TGR) at the South Pole.
In summary, I invoke Arthur Viterito`s research[14]showing a 300% increase in earthquake activity along global mid-ocean ridge spreading zones coinciding with one of the largest known El Nino/La Nina events in modern history, together with the 44% parallel increase in the TGR (Figure 3), as further evidence of a connection between plate tectonic activity, deep sea geochemical exchange, and changes in tropospheric CO2.
Note that the paleorecord also shows that enhanced magmatic and hydrothermal activity in the EPR region during both the Holocene and Eemain eras have been reported to coincide with Milankovitch Cycle glacial termination events, and the rise in ice-core CO2 and proxy temperatures that peaked during both interglacial eras’ thermal maximums[15].
In closing, this model of the Carbon Cycle is contrary to the mainstream perspective by claiming the atmospheric TGR and dδCO2/dt are first-order functions of Walker Circulation.
If true, this not only turns the ocean into a net source of atmospheric CO2 but makes the Pacific Ocean a larger contributor than humans to the global imbalance between carbon sources and sinks in the modern era.
At BIG Media Ltd., we welcome constructive criticism and debate, so there is no need to be shy with your thoughts on this article.
References:
[1] Pacific Walker circulation and the tropospheric CO2 growth rate – BIG Media
[2]Physical pathways for carbon transfers between the surface mixed layer and the ocean interior – Levy – 2013 – Global Biogeochemical Cycles – Wiley Online Library
[3] Global Monitoring Laboratory – Carbon Cycle Greenhouse Gases – NOAA
[4]Ekman Pumping – an overview – ScienceDirect Topics
[5]1995: An Important Inflection Point in Recent Geophysical History – Juniper Publishers
[6]Seismic predictors of El Ni˜o revisited -Wiley Online Library
[7]Decadal variability of the air‐sea CO2 fluxes in the equatorial Pacific Ocean – Feely – 2006 – Journal of Geophysical Research: Oceans – Wiley Online Library
[8]6A: Down to the Deep – The Ocean’s Biological Pump -The Science Education Resource Center – Carleton College
[9](PDF) Ocean “Acidification” Alarmism in Perspective – ResearchGate
[10]Hydrothermal Vents Are a Source of Old Refractory Organic Carbon to the Deep Ocean – Luther – 2021 – Geophysical Research Letters – Wiley Online Library
[11]Dissolved Organic Radiocarbon in the Eastern Pacific and Southern Oceans – Druffel – 2021 – Geophysical Research Letters – Wiley Online Library
[12](PDF) Radiocarbon in dissolved organic carbon of the South Pacific Ocean – ResearchGate
[13][PDF] Natural Radiocarbon Distribution in the Deep Ocean – Semantic Scholar
[14] 1995: An Important Inflection Point in Recent Geophysical History – Juniper Publishers
[15](PDF) Enhanced East Pacific Rise hydrothermal activity during the last two glacial terminations – ResearchGate
(Dr. Joseph Fournier – BIG Media Ltd., 2024)