Since the COVID vaccines were first given emergency approval in the United States, Canada, and much of the world, the question of their effectiveness has been top of mind. We showed that vaccine effectiveness (VE) is part of the rational decision to vaccinate or not in this article, Prisoner’s dilemma and vaccination as it helps define the utility of vaccinating. Most recently, we discussed the VE against severe outcomes in Alberta, Canada, for the booster (3 doses), 2 doses and 1 dose of vaccine in Evaluating the effectiveness of COVID-19 booster shots and Are booster shots actually boosting?
In every discussion of VE, there are choices regarding how calculations are made. Although we use the screening method – which is essentially an objective, scientific process – certain decisions are still required in the calculation.[1]In every calculation, we must make these choices, all of which will affect the estimates of VE. Some data effects may even lie beyond our choice; a bias may exist in the way a health organization gathers data. In such a situation, we may be left with the decision to attempt to remove the bias – if it can be removed.
In every case – whether it is a choice in the calculation, or a bias inherent in the data – it is in the reader’s interest to understand these effects. We discuss three of these data effects, and consider if they are valid, whether they may create bias, or even if they are erroneous. The three effects are:
- Demographic effects: whether we should use the entire population or exclude children under 12 for severe outcome calculations.
- Infections during the first 14 days after vaccination: should we include these infections as vaccinated, unvaccinated, or should we exclude them?
- Improper categorization of severe outcomes: when individuals being admitted to the hospital or ICU for non-COVID reasons, but are counted as “COVID” severe cases because they tested positive. This inflates the case numbers, likely skewing the data toward a lower VE.
Effect of demographics: VE from all ages versus 12+
We reported a demographic issue with our booster analysis: most persons with 3 doses were older, and most people with 1 or 0 doses were younger. This is apparent in the chart below.

Chart outlining demographics for each vaccination type in Alberta, Canada, as of Jan 31, 2022.[2]The population of the boosters (in red) skew older, while the population of the single-dose and unvaccinated groups skew younger. The fact that each dose has materially different demographics creates a challenge in evaluating the effectiveness of the vaccines by dose.
As described in Are booster shots actually boosting? we decided to mitigate these demographic effects by excluding children under 12 years old. In a study of non-severe outcomes, we would use the entire population, but because these young children rarely become severely ill from COVID infection, such an exclusion was justified, and – we argue – the best choice to make.
Or was it?
There is no perfect answer. Excluding members of the population is a powerful choice not to be taken lightly. The reasoning was sound, but it may also not have been incorrect to keep the entire population. Rather than calling the decision right or wrong, let us examine its effect.
In the charts to follow, we compare VE estimates with the 12+ population against the same calculations for the entire, or all ages, population.
The first chart is the VE for ICU severity. The 3-dose VE curve experiences about a 10% drop when all ages are used with reference to the 12+ estimates, which is material, but the 2-dose VE shows an even greater loss of relative value. The 1-dose VE estimates barely change, which is due to the offsetting effects of removing the under 12 kids from both 1-dose and unvaccinated.
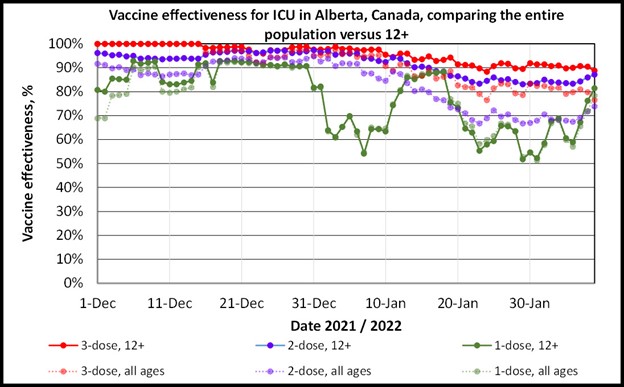
ICU severity VE estimates by dosage in Alberta, Canada, in December 2021 to January 31, 2022, by doses, and for either 12+ ages or the entire population.[3]The entire population VE estimates are significantly lower for 3-dose and 2-dose VE estimates and relatively unaffected for 1-dose.
For easier viewing, a series of charts follows, one for each of the number of doses being analysed.
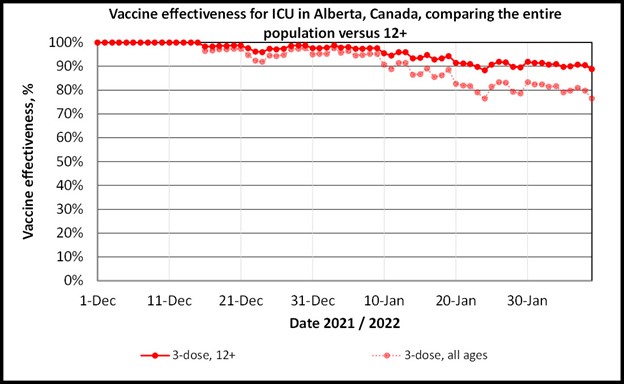
ICU severity VE estimates by dosage in Alberta, Canada, December 2021 to January 31, 2022, for 3 doses, and for either 12+ ages or the entire population.[4]The entire population VE estimates are significantly lower for the 3-dose VE calculation, reaching a drop of about 10%.
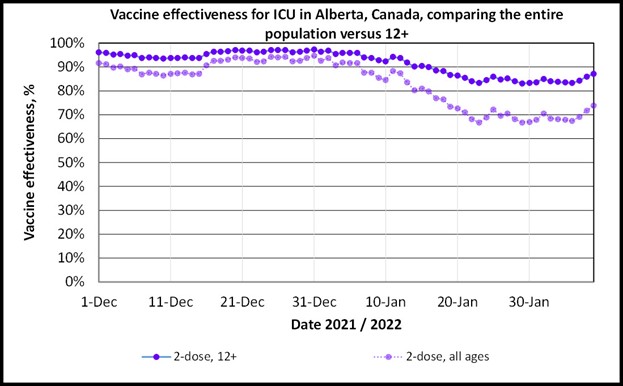
ICU severity VE estimates by dosage in Alberta, Canada, December 2021 to January 31, 2022, for 2 doses, and for either 12+ ages or the entire population.[5]The entire population VE estimates are significantly lower for the 2-dose VE calculation, reaching a drop of greater than 10%.

ICU severity VE estimates by dosage in Alberta, Canada, December 2021 to January 31, 2022, for 1 dose, and for either 12+ ages or the entire population.[6]The estimates are similar due to children under 12 dominating the unvaccinated and single-dose populations. These effects offset.
The same analysis was performed for non-ICU hospitalization severity VE analysis. The results were similar in meaning, if also of greater magnitude. The 3-dose and 2-dose VE estimates drop significantly when the entire population is used in the analysis. The 1-dose VE calculation is relatively unchanged due to offsetting effects in the single-dose and unvaccinated groups dominated by children under 12 years old.
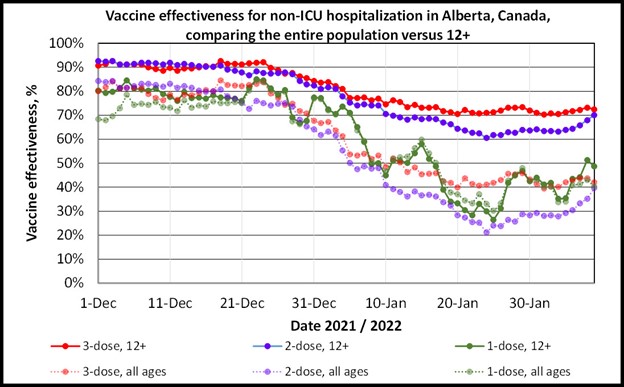
Non-ICU hospitalization severity VE estimates by dosage in Alberta, Canada, December 2021 to January 31, 2022, by doses, and for either 12+ ages or the entire population.[7]The entire population VE estimates are significantly lower for 3-dose and 2-dose VE estimates and relatively unaffected for 1-dose.
Charts illustrating one dosage level at a time follow:
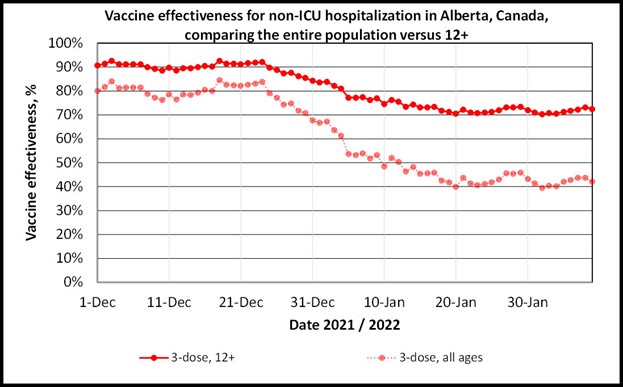
Non-ICU severity VE estimates by dosage in Alberta, Canada, December 2021 to January 31, 2022, for 3 doses, and for either 12+ ages or the entire population.[8]The entire population VE estimates are significantly lower for the 3-dose VE calculation, reaching a dip of close to 30%.
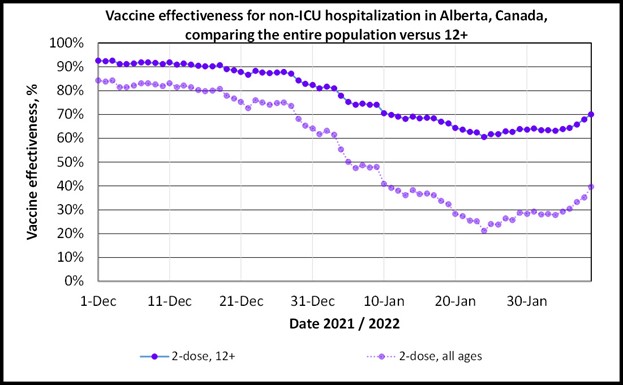
Non-ICU hospitalization VE estimates by dosage in Alberta, Canada, December 2021 to January 31, 2022, for 2 doses, and for either 12+ ages or the entire population.[9]The entire population VE estimates are significantly lower for the 2-dose VE calculation, reaching decreases greater than 30%.
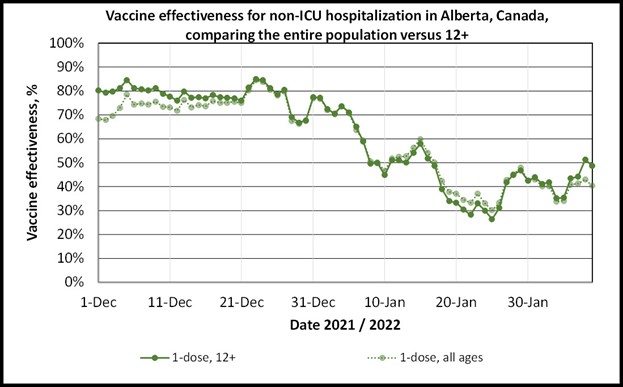
Non-ICU hospitalization VE estimates by dosage in Alberta, Canada, December 2021 to January 31, 2022, for 1 dose, and for either 12+ ages or the entire population.[10]The estimates are similar due to children under 12 currently dominating the unvaccinated and single-dose populations. These effects offset.
Effect of exclusions within 14 days after receiving a vaccine dose
The 14-day period after a vaccination is a gray area; one is not considered to have benefited fully from the vaccine dose. Persons who become sick with COVID during this 14-day period can be difficult to categorize. Are they considered vaccinated or unvaccinated by that dose? In the case of getting sick within 14 days of receiving the second dose, should the person be considered to have 1 dose?
The World Health Organization (WHO) recommends removing persons who fall into this category from VE data.[11]This means that the data is removed and not counted toward any vaccination status. Claims have been made that the Government of Alberta has not excluded the 14-day post vaccination persons from death data, but has instead placed them in the unvaccinated category.[12]BIG Media follows the WHO recommended exclusion standard.
Improper categorization of severe outcomes: a bias toward a VE of zero
With the widespread rise in COVID cases due to the Omicron variant, certain hospital jurisdictions in the United States and Canada began to keep track of individuals who were admitted to either the hospital or ICU primarily because they had COVID – also called “for COVID” – as opposed to individuals admitted primarily for other reasons, but who happened to have milder degrees of COVID, or the “with COVID” patients.
On January 7, 2022, the state of New York reported that 43% of patients admitted to the hospital were admitted “with COVID”.[13]On February 12, 2022, Alberta reported that for the last week, 58.5% of non-ICU patients who tested positive for COVID were admitted for reasons other than the disease, while 50.7% of the ICU patients with COVID were admitted for reasons other than COVID.[14]Ontario reports slightly different numbers on February 12, claiming that 47% of non-ICU patients who tested positive for COVID were admitted for reasons other than COVID, while 19% of the ICU patients with COVID were admitted for reasons other than COVID.[15]
Ideally, such a classification would be straightforward, and the patients admitted to the hospital or ICU with COVID, but not because of COVID, would be removed from a VE calculation. But what would happen if they were not removed?
In such a case, a data bias would be created. If we assume that there is no significant difference in the chances that persons of one vaccination status or the other would be admitted to the hospital or ICU for non-COVID reasons, the bias can be estimated using the percentage of the population that is vaccinated. It should be noted that the assumption of “no significant difference in the chances” is likely supported by the new case VE being low or near zero as in Omicron update: vaccine effectiveness against ICU admission holds at 80%, where mild (new case) VE was negative. However, this assumption should be treated as untested, and readers should be aware that there could be other tendencies in the “with COVID” population.
In the chart below, we create an example case for this potential bias using the given assumption. We consider the VE for severe cases, where the true VE is 90%. Then we add, in population weighted amounts, cases for each vaccine category due to reasons other than COVID, and calculate an “Apparent” VE. As the percentage of improperly categorized patients increases, the apparent VE drops. In the extreme, the VE approaches zero.
This is a simple example with an untested assumption. However, it is likely that such a categorization error would create a bias toward lower VE estimates.
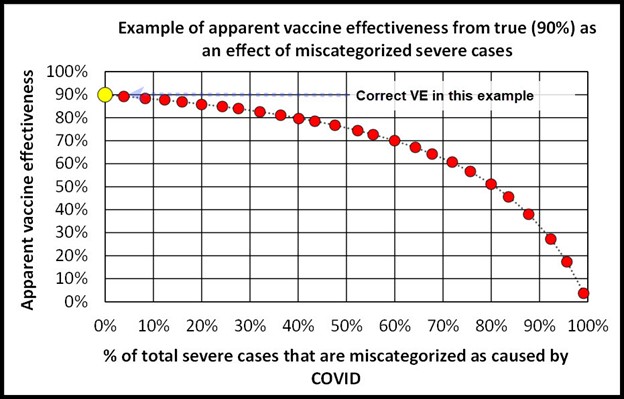
Chart illustrating a case for the potential effect of patients in the hospital or ICU who have COVID but were admitted for reasons other than COVID. The true VE in this example is 90%, but as the percentage of improperly categorized cases increases, the apparent VE drops. This simple example relies on an assumption that vaccinated and unvaccinated persons have an equal chance of being admitted for reasons other than COVID. A scenario with 100% of cases being wrongly categorized can never be reached and is illustrative only.
Interpretation
As mentioned at the outset, there are choices to be made in calculating vaccine effectiveness. Our choices in this analysis are supported by logic, common data-science practices, and even guidance from the World Health Organization.
Excluding children under the age of 12 was the right choice in order to present the findings accurately and responsibly. Given that few individuals under 12 suffer from severe outcomes, their exclusion is suitable when mild cases are not under consideration. VE values for subjects having received 3 doses and 2 doses are materially higher when the children are excluded.
Improperly categorizing patients in hospitals or ICUs is certainly an error, which may not be remedied if the data is not properly tracked and reported by health authorities. It is likely that flawed categorization of severe outcomes has led to inflated case numbers being reported as due to the disease in hospitals or specifically in ICUs. Such an error would likely result in a downward bias to the VE estimates. The abrupt drop in VE against hospitalization and less severe drop in ICU VE estimates in Ontario in December 2021 and January 2022 reported in Omicron update: vaccine effectiveness against ICU admission holds at 80% may be influenced by this effect.
References
[1] Cohen, Adam et al, 2012, An Assessment of the Screening Method to Evaluate Vaccine Effectiveness: The Case of 7-Valent Pneumococcal Conjugate Vaccine in the United States, PLOS ONE
[2] Interactive aggregate data on COVID-19 cases in Alberta, Government of Alberta, February 2, 2022
[3] Interactive aggregate data on COVID-19 cases in Alberta, Government of Alberta, February 2, 2022
[4] Interactive aggregate data on COVID-19 cases in Alberta, Government of Alberta, February 2, 2022
[5] Interactive aggregate data on COVID-19 cases in Alberta, Government of Alberta, February 2, 2022
[6] Interactive aggregate data on COVID-19 cases in Alberta, Government of Alberta, February 2, 2022
[7] Interactive aggregate data on COVID-19 cases in Alberta, Government of Alberta, February 2, 2022
[8] Interactive aggregate data on COVID-19 cases in Alberta, Government of Alberta, February 2, 2022
[9] Interactive aggregate data on COVID-19 cases in Alberta, Government of Alberta, February 2, 2022
[10] Interactive aggregate data on COVID-19 cases in Alberta, Government of Alberta, February 2, 2022
[11] WHO, March 17, 2021, Evaluation of COVID-19 vaccine effectiveness: INTERIM GUIDANCE
[12] Smalley, Joe, January 13, 2022, Alberta just inadvertently confessed to fiddling the COVID vaccination stats
[13] Radcliffe, Shawn, January 13, 2022, The Difference Between Being Hospitalized ‘For COVID’ and ‘With COVID’, Healthline
[14] Hospitalizations, Government of Ontario, February 12, 2022
[15] Interactive aggregate data on COVID-19 cases in Alberta, Government of Alberta, February 12, 2022
(Lee Hunt – BIG Media Ltd., 2022)